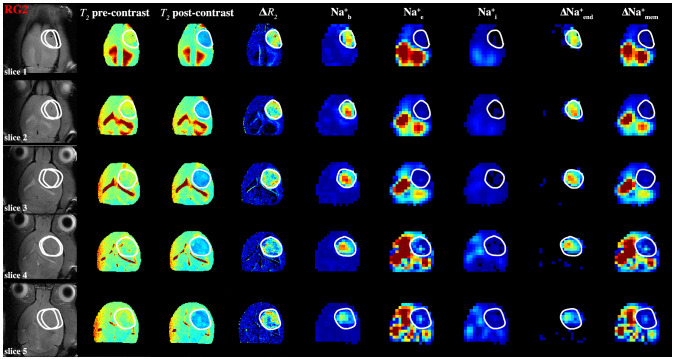
Figure 4.
Spatial distributions of compartmentalized 23Na signals (Na+b, Na+e, Na+i) as well as transendothelial (ΔNa+end) and transmembrane (ΔNa+mem) gradients in an RG2 tumor. The high-resolution 1H-MRI data are shown in the left four columns, whereas the lower resolution 23Na-MRSI data are shown in the next five columns on the right. The left column shows the tumor location (white outline) on the anatomical 1H-MRI (left), whereas the next two columns show the T2 maps (range shown: 0–100 ms) before and after TmDOTP5− injection, and the subsequent column depicts the ∆R2 map (i.e., difference between 1/T2 maps before and after, range shown: 0–30 s−1), which is proportional to [TmDOTP5-] in healthy and tumor tissues. Since ∆R2 values are more heterogeneous within the tumor, the 23Na-MRSI data are needed to separate the blood and extracellular compartment signals for the tumor. Since the integral of each 23Na peak represents the [Na+], the respective three columns show the integral maps of Na+b, Na+e, and Na+i from left to right (i.e., ∫Na+b, ∫Na+e, ∫Na+i). The last two columns on the right show ΔNa+end = ∫Na+b-∫Na+e and ΔNa+mem = ∫Na+e-∫Na+i. The ∫Na+b map reveals low values in healthy tissue compared to tumor tissue, and within the tumor boundary a high degree of heterogeneity. The ∫Na+e map reveals low values in tumor and normal tissues, but within the tumor boundary a small degree of heterogeneity is visible while ventricular voxels show very high values. The ∫Na+i map reveals low values ubiquitously except some ventricular voxels. The ΔNa+end map reveals dramatically high values within the tumor only. The ΔNa+end was driven primarily by an increase of ∫Na+b inside the tumor and which was more pronounced in superficial regions of the brain compared to deeper slices. The ΔNa+mem map shows low values in tumor tissue compared to normal tissue, although ventricular voxels show very high values. The ΔNa+mem is driven primarily by decreased ∫Na+e and thus shows similar level of heterogeneity as the ∫Na+e map. All maps use the same color scale and are relative. See Figure S4 for an example for a U87 tumor.

