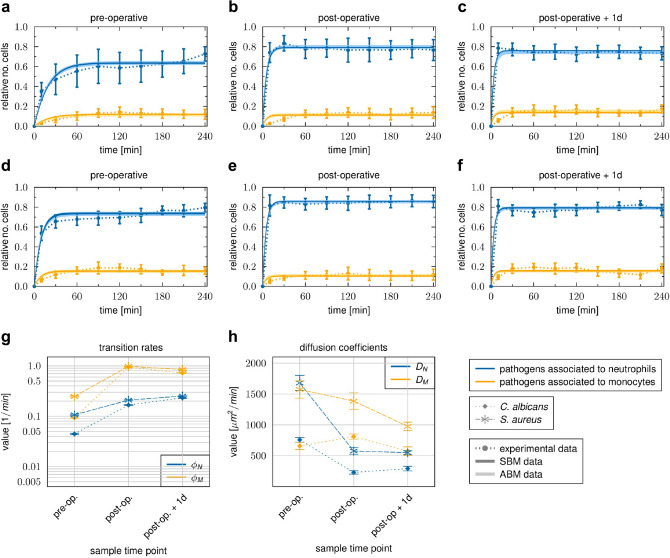
Figure 4.
Time courses of pathogen association to immune cells observed in whole-blood samples of HLM patients. Blood samples were taken before cardiac surgery (pre-operative), immediately after surgery (post-operative) and one day after admission to intensive care (post-operative + 1d). Time-resolved experimental data (dotted line) were obtained by whole-blood infection assays with either C. albicans (a–c) or S. aureus (d–f). Data points and error bars refer to the means and SD of blood samples from six HLM patients. The simulated dynamics of the combined units (solid line) were obtained by fitting the state-based model (SBM, dark color) and the agent-based model (ABM, light color) to the experimental data. The thickness of the results from the SBM represents the SD obtained by 50 simulations with transition rate values that were sampled within their corresponding SD. The thickness of the results from the ABM represents the SD obtained from 30 stochastic simulations of the ABM with the estimated diffusion coefficients. (g) Transition rate values of the SBM resulting from fitting the model to experimental data of either C. albicans or S. aureus infection in blood samples from HLM patients. The transition rate values are given for the phagocytosis rate of neutrophils and the phagocytosis rate of monocytes. (h) The diffusion coefficients are given for neutrophils and monocytes . Mean and SD are calculated from all parameter sets with a mean LSE that lies within the SD of the optimal parameter set.

