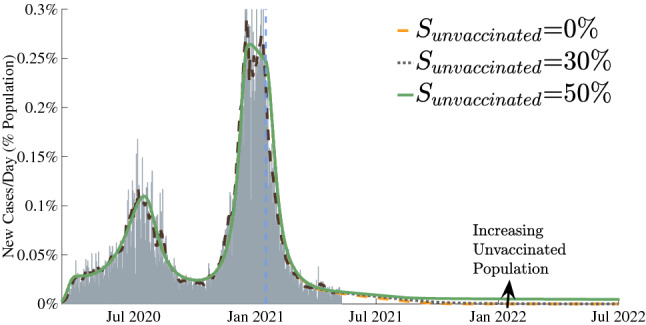
Figure 6.

Results for certain fractions of the population remaining unvaccinated. The entire COVID-19 case history and future predictions are shown in terms of estimated actual new infection cases for California as a representative example. Gray bars represent the daily reports of new COVID-19 cases. The dashed brown lines are the corresponding 7-day average. Our model predictions for the entire duration are also shown as green, gray and yellow curves.
