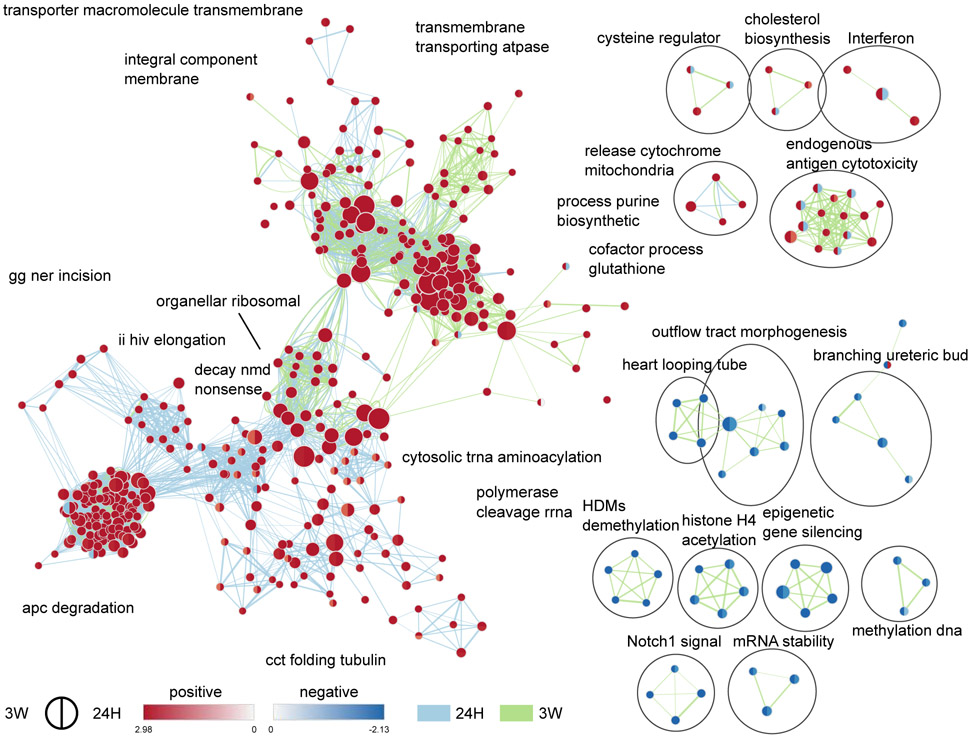
Figure 4.
Time-specific functional enrichment following cohabitation with an opposite-sex partner in female prairie voles. Enrichment maps depicting the clusters of differentially modulated pathways following cohabitation when compared to sexually-naive controls (SN) in females, identified by gene-set enrichment analyses. The area of each node, representing a gene-set (functional pathway), corresponds to the number of genes of the gene-set it contains, and its color depicts the direction of enrichment (red: positive, blue: negative) with the color intensity representing the enrichment score, when compared to the SN group either in the 24H dataset (right half), or 3W dataset (left half). As a result, a gene-set with different colors in their two halves display opposite directions of regulation in the early (24H) and later (3W) phases of the bonding process when compared to SN controls. Edge thickness is proportional to the number of genes overlapping between the two connected nodes. Blue and green edges correspond to the 24H vs SN, and 3W vs SN datasets, respectively. 24H: 24 hrs of cohabitation, 3W: 3 weeks of cohabitation.

