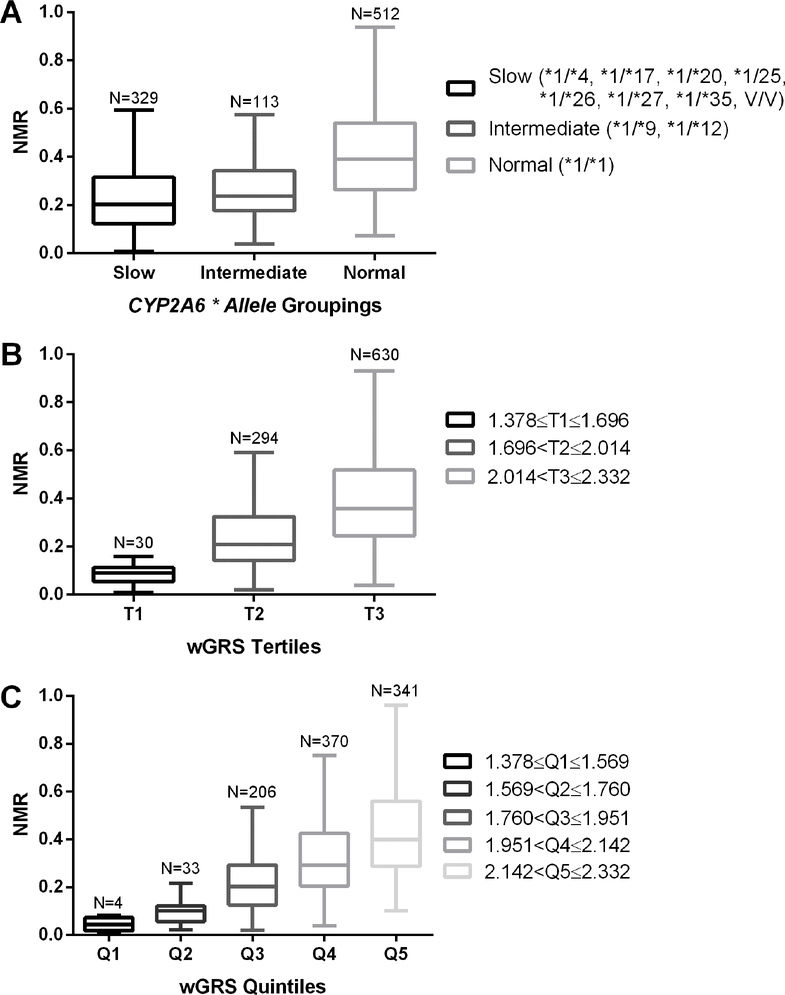
Figure 3.
Tukey box-and-whisker plots of nicotine metabolite ratio (NMR) distributions by genotype grouping. Data from the training set (N=954) is grouped as a function of A) * allele groupings; SM, slow metabolizers; IM, intermediate metabolizers; NM, normal metabolizers(48), V/V, two variant * alleles, B) wGRS scale (1.378–2.332) split into tertiles (T, tertile) and C), weighted genetic risk score (wGRS) scale (1.378–2.332) split into quintiles (Q, quintile)

