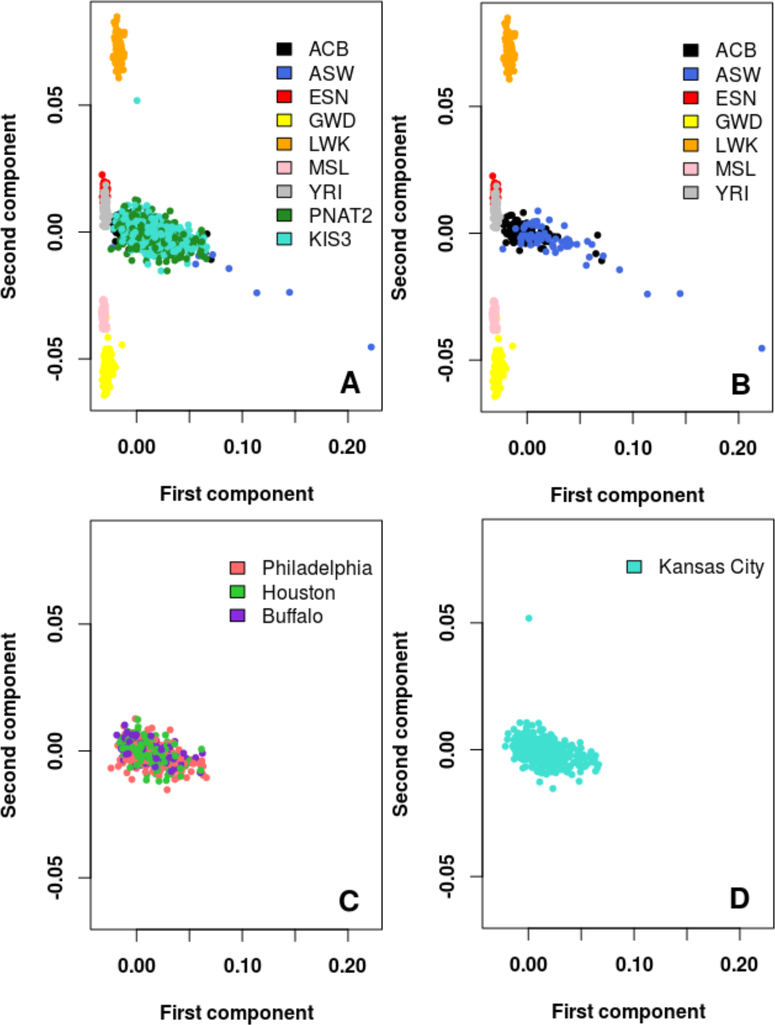
Figure 4.
Principal component analyses showing fine AFR population substructure. Principal components were computed from merging the 1KG AFR subpopulations and the training set (PNAT2+KIS3 AFR) samples. A) 1KG AFR subpopulations and training set (PNAT2+KIS3 AFR) participants plotted. B) 1KG AFR subpopulations plotted only. C) PNAT2 participants split by geographic recruitment sites plotted only. D) KIS3 participants plotted only.
(ACB: 1KG African Caribbeans; ASW: 1KG Southwest Americans; LWK: 1KG Luhya; ESN: 1KG Esan; GWD: 1KG Gambian; MSL: 1KG Mende; YRI: 1KG Yoruba).
Note: The PNAT2 Toronto site was excluded from the analyses in this Figure to the small sample size (N=14)

