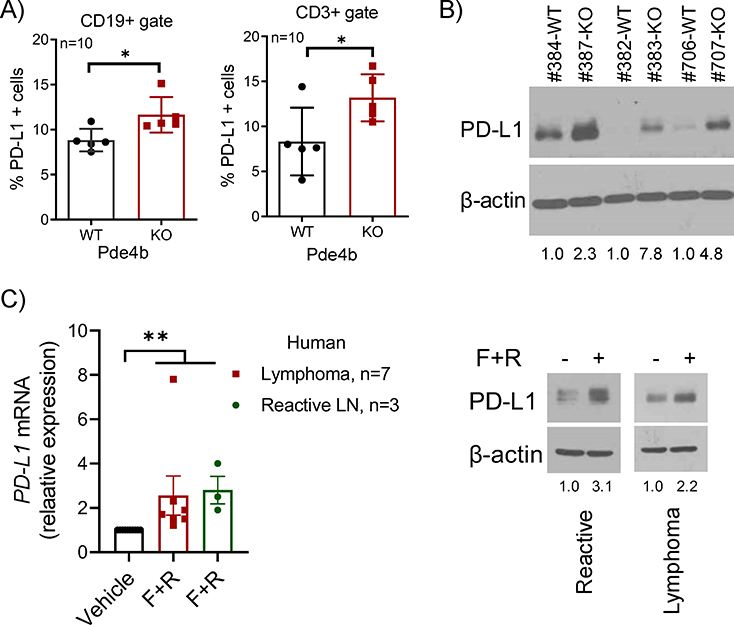
Figure 2. Modulation of PD-L1 expression by the cAMP-PDE4 axis in vivo.
A) FACS analysis of cell-surface PD-L1 expression in splenic B (CD19+) and T (CD3+) cells from Pde4b+/+ (WT) and −/− (KO) mice (n=10). Data shown are mean ±SD; p values are from a two-sided Student’s t-test, *p<0.05. B) WB of PD-L1 in spleen cells of Pde4b KO mice or WT littermates C) left panel - Q-RT-PCR-based quantification of PD-L1 in 10 primary human samples – 3 reactive lymph nodes and 7 mature B cell lymphomas (MCL, MZL, DLBCL, SLL, LPL, FL and CLL) cultured for 8h in presence of vehicle (DMSO) or forskolin (20μM) + roflumilast (10μM) (F+R); each sample data point represents the mean of quantifications performed in triplicate; data shown are mean ±SEM; p value was calculated with one-way ANOVA and Tukey’s post-test, ** P<0.01; right panel - WB of PD-L1 in two representative human primary samples from which enough material was available for protein isolation. Densitometric quantification is shown below the WB in B) and C).

