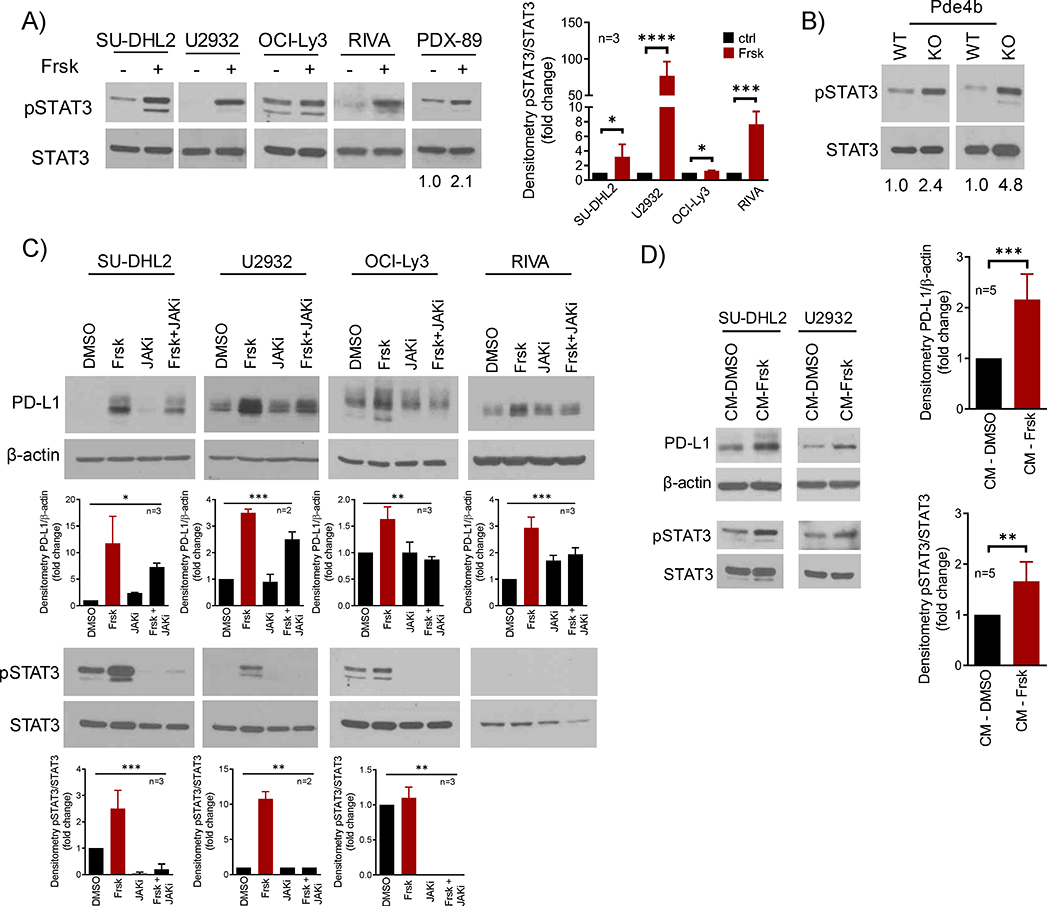
Figure 3. Secreted factors acting on the JAK/STAT signals mediate cAMP induction of PD-L1 expression.
A) WB analysis of pSTAT3 (Y705) and total STAT3 in DLBCL cell lines and PDX model following exposure to forskolin (Frsk, 40μM, 4–16h). The more modest increase in pSTAT3 in OCI-Ly3 reflects the constitutive activity of STAT signals in this cell line - densitometric quantification (pSTAT3/STAT3) of biological replicates is shown on the right, data shown are mean ± SD of replicates, p values are from two-sided Student’s t-test. B) WB of pSTAT3 (Y705) and total STAT3 in spleen cells of Pde4b KO mice or WT littermates; densitometric quantification (pSTAT3/STAT3) is shown below the WBs. C) WB of PD-L1 and pSTAT3 (Y705) in DLBCL cell lines exposed to DMSO, forskolin (Frsk, 40μM), JAKi (JAK inhibitor pyridone 6, 5μM) or their combination for 16h. STAT3 phosphorylation in the RIVA occurs early and it is labile, thus it is detected after 4h exposure to forskolin (panel A), but not after 16h (panel C); the OCI-Ly3 pSTAT3/STAT3 displays in panels A and C are from the same WB; densitometric quantification is shown below the WBs (PD-L1/β-actin; pSTAT3/STAT3), data shown are mean ± SD of biological replicates, p values are from one-way ANOVA. D) WB of PD-L1 and pSTAT3 (Y705) in DLBCL cell lines cultured for 8h in conditioned media (CM). The forskolin-free CM was obtained from DLBCL cell lines exposed to DMSO or forskolin (Frsk, 40uM) for 1h, followed by a drug wash-off and replenishment with fresh media. densitometric quantification of biological replicates (n= 5, 3 for DHL2, 2 for U2932) is shown on the right (PD-L1/β-actin; pSTAT3/STAT3); data are mean ± SD, p value is from a two-sided Student’s t-test.

