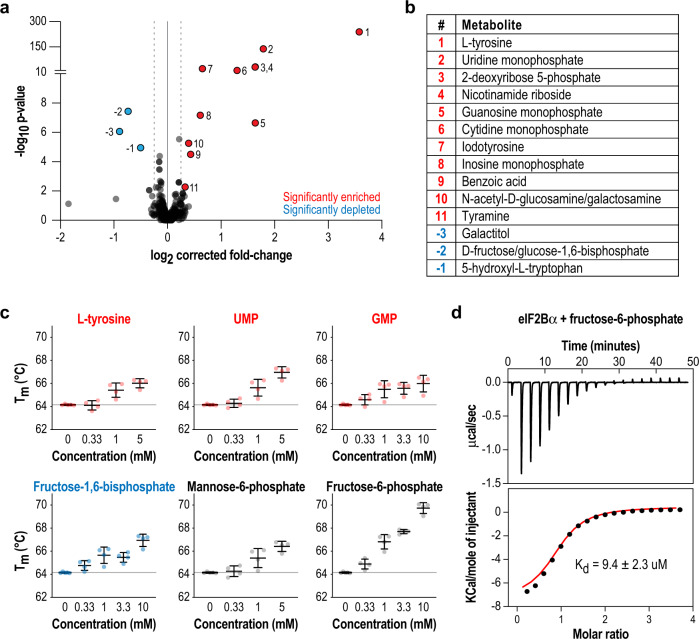
Fig. 1. Unbiased screening by MIDAS identifies putative ligands that interact with eIF2Bα.
a Volcano plot of metabolites analyzed in MIDAS, comparing the fold-change between the protein chamber and metabolite chamber. Red indicates metabolites that were significantly enriched in the protein-containing chamber, whereas blue indicates metabolites that were significantly depleted (q < 0.1) based on a two-tailed Wald test. The full data are available as Supplementary Data 1. b All 16 significant hits from the MIDAS binding screen numbered in a are tabulated. c Differential scanning fluorimetry of eIF2Bα in combination with selected metabolites in dose–response. Metabolite binding increased the Tm of eIF2Bα. Bars are mean ± standard deviation of n = 4 independent experiments. Color coding in b, c are as in a. d Kd of the eIF2Bα–F6P interaction measured by ITC. The upper subpanel shows the baseline-subtracted thermogram. The bottom subpanel represents the binding isotherm, with the red line indicating the fit curve.

