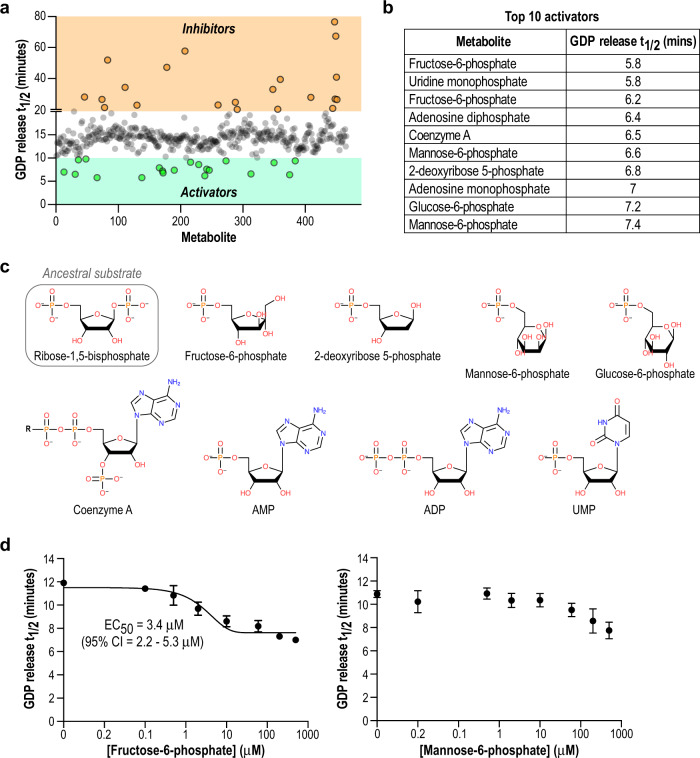
Fig. 2. Unbiased activity-based screening identifies 5′/6′ sugar phosphates as eIF2B activators.
a Plot of individual metabolites arrayed against GDP release t1/2 derived from the GEF activity assay. Based on the basal activity of eIF2B under these assay conditions, a t1/2 cutoff of <10 min was used to define activators (green) and a cutoff of >20 min was used to define inhibitors (orange). b List of the top 10 activators from the screen, ordered by GDP release t1/2. The full data are available as Supplementary Data 2. c Structures of the top 10 activators from the screen, compared to the substrate of archaeal RBPI. The sugar ring and 5′/6′ phosphate moiety are common structural motifs. d GDP release t1/2 of eIF2B using increasing concentration of F6P or M6P. Only the eIF2B + F6P data could be fit to a dose-response curve with R2 > 0.9. Each point represents mean ± standard deviation of 3 technical replicates.

