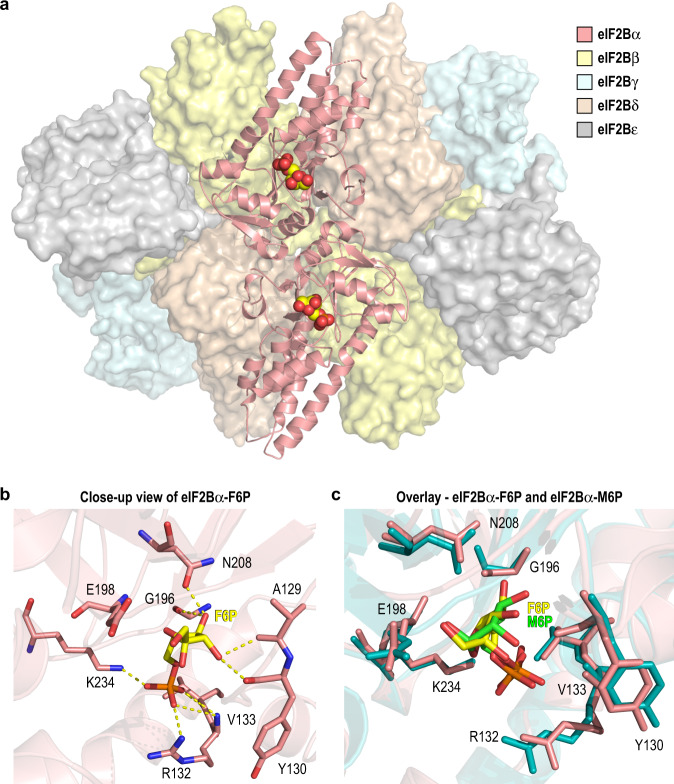
Fig. 3. 2.9 Å cryo-EM structure of eIF2B in complex with F6P.
a Overall structure of the eIF2B-F6P complex with eIF2Bα in cartoon representation and eIF2Bβ/δ/γ/ε represented as surfaces (PDB 7KMF). The single F6P molecule bound within each eIF2Bα monomer is shown as space-filling spheres. b Close-up view of the eIF2Bα metabolite binding pocket, with residues contributing to the F6P interaction shown in stick representation. H-bonds are represented by dashed yellow lines. c Overlay of the sugar phosphate binding pockets in the eIF2B-F6P cryo-EM structure (pink) and the eIF2Bα-M6P crystal structure (PDB 7KMA; teal). F6P and M6P are shown as yellow and green sticks, respectively.

