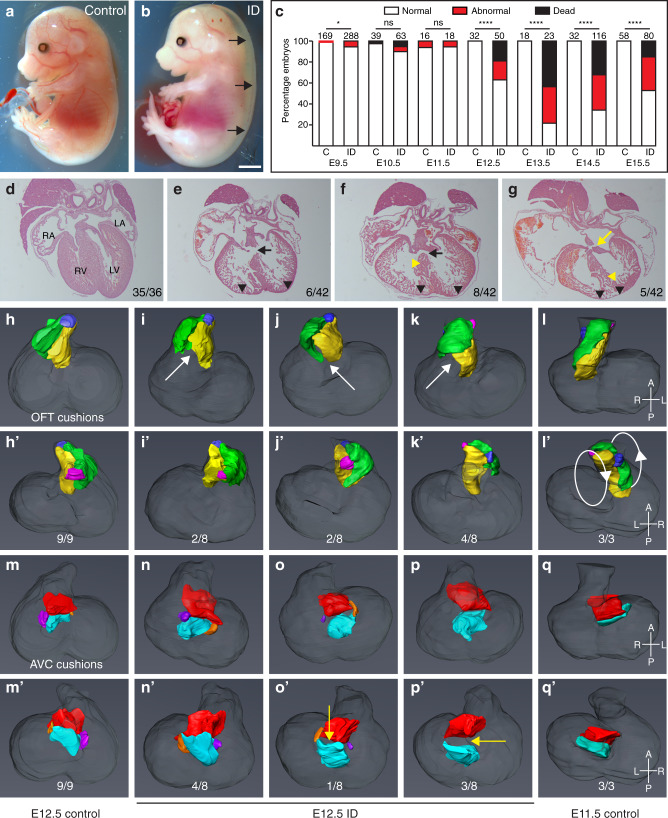
Fig. 1. Maternal ID causes embryonic defects and lethality.
a, b Embryos from ID mothers have gross sub-cutaneous oedema. Representative images of control (a) and ID (b) E15.5 embryos. Black arrows indicate subcutaneous oedema. c Histograms of a developmental time-course showing significant embryonic lethality from E12.5. d–g Representative frontal H&E sections of hearts from control (d) and ID (e–g) E15.5 embryos. VSD (black arrows), AVSD (yellow arrow), thin ventricular myocardium (black arrowheads) and disorganised ventricular septum (yellow arrowheads) are indicated. Relative incidence of each phenotype in all hearts analysed by µMRI, HREM and paraffin sectioning are indicated. h–q Abnormal cushion formation in E12.5 ID embryos. h–l Representative 3D Amira reconstructions of OFT cushions from manually segmented HREM data showing dorsal (h–l) and ventral (h’–l’) views of (h) E12.5 control embryo, (i) normally rotated OFT from E12.5 ID embryo, (j) partially rotated OFT from E12.5 ID embryo, (k) non-rotated OFT from E12.5 ID embryo, (l) E11.5 control embryo. The left OFT cushion (yellow), right OFT cushion (green), aortic ICC (pink) and pulmonary ICC (blue) are shown. White arrows indicate unfused proximal cushions. m–q 3D reconstructions of the AV cushions showing dorsal (m–q) and ventral (m’–q’) views from the same embryos. The superior AV cushion (red), inferior AV cushion (cyan), left lateral AV cushion (orange) and right lateral AV cushion (purple) are shown. Yellow arrows indicate non-touching AV cushions. Statistical significance was tested using one-sided Fisher’s exact test (panel c). P values: E9.5 0.0143; E10.5 0.1735; E11.5 0.7273; E12.5 < 0.0001; E13.5 < 0.0001; E14.5 < 0.0001; E15.5 < 0.0001. ns not significant, *P < 0.05, ****P < 0.0001. Scale bar = 2 mm (a, b) and 200 µm (d–g).

