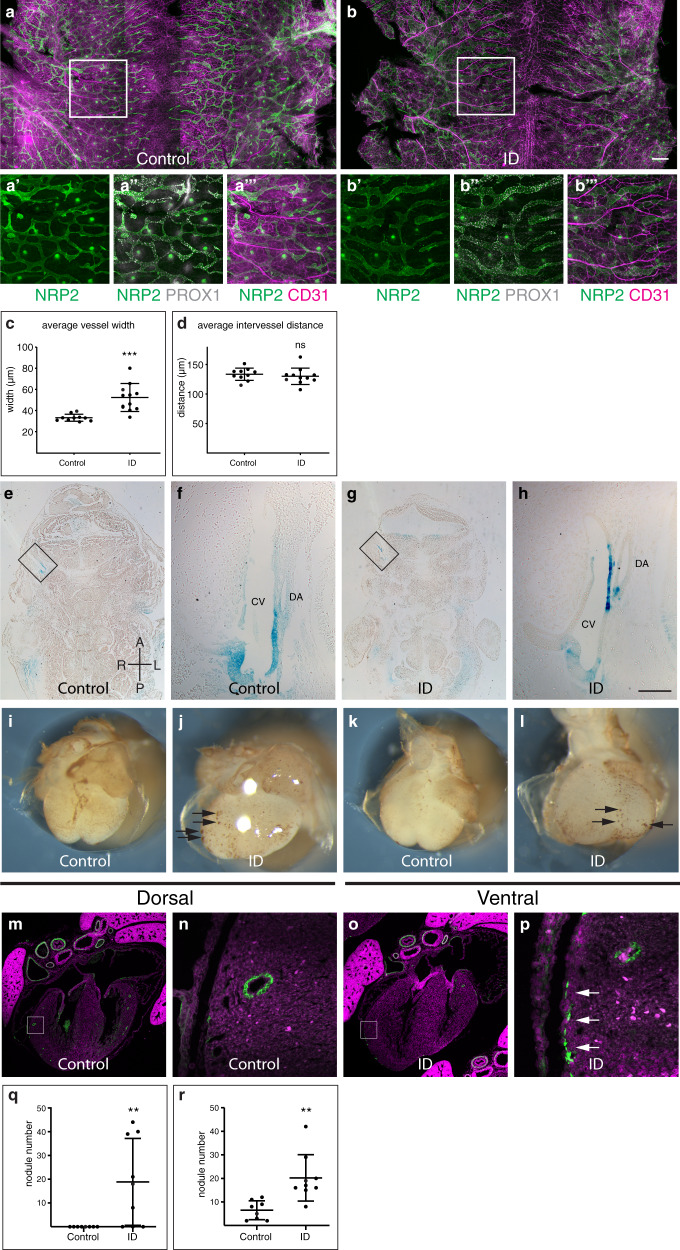
Fig. 5. Lymphatic and coronary vasculature development is perturbed in ID embryos.
a–m Lymphatic development. a–d Comparison of NRP2, PROX1 and CD31 expression in back skin from control (a) and ID (b) E14.5 embryos. Magnified views of the boxed areas are shown in panels a’–a”’ and b’–b”’, respectively (see also Supplementary Fig. 5). Quantification of the average lymphatic vessel width (c) and average intervessel distance (d) in control (n = 10) and ID (n = 11) embryos. e–h Comparison of RA signalling levels in frontal sections of control (e) and ID (g) E11.5 embryos carrying the RARE-LacZ transgene. (f, h) Magnified views of the boxed areas in (e) and (h), respectively. i–r Coronary vasculature development. Comparison of CD31 staining of E14.5 hearts from control (i, k) and ID (j, l). Black arrows indicate endothelial nodules. Quantitation of endothelial nodule number on the dorsal (q) and ventral (r) surfaces of control (n = 8) and ID (n = 9) hearts. m–p Comparison of CD31 (green) expression in the coronary vasculature of control (m) and ID (o) E17.5 embryos. Nuclei were stained with TO-PRO-3 (magenta). Magnified views of the boxed areas are shown in panels (n) and (p), respectively. White arrows indicate ectopic CD31 staining. Graphs show mean ± standard deviation. Statistical significance was tested by two-sided unpaired t-test with Welch’s correction (panels c, r), two-sided unpaired t-test (panel d) or two-sided Mann–Whitney U test (panel q). P values: 0.0006 (panel c); 0.5299 (panel d); 0.0090 (panel q); 0.0028 (panel r). ns not significant, **P < 0.01, ***P < 0.001. Scale bar = 715 μm (a, b); 370 µm (a’–b”’); 755 µm (e, g); 95 µm (f, h); 680 µm (i–l); 640 µm (m, o); 64 µm (n, p). CV cardinal vein, DA dorsal aorta.

