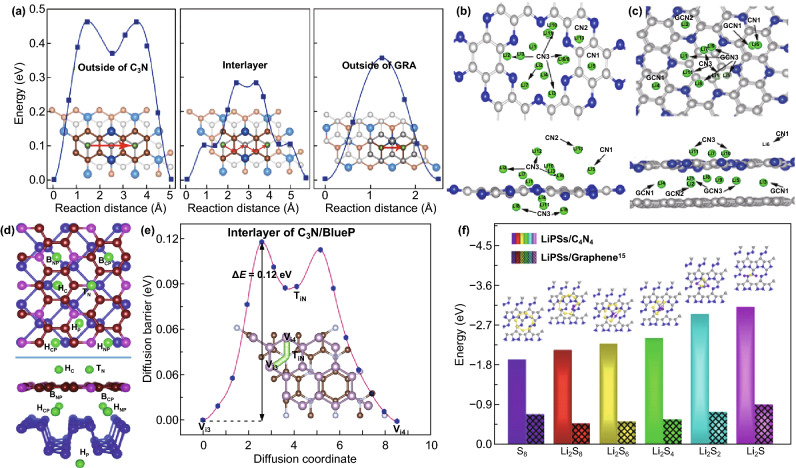
Fig. 9.
a Energy profiles for Li atom diffusion on C3N/GRA, along with the corresponding pathways denoted as red arrows. Carbon atoms from graphene—gray balls, carbon atoms from C3N—orange balls, nitrogen atoms—blue and lithium atoms—green. Reproduced with permission from Ref. [37]. b Top and side views of Li13–C2N structure; c top and side views of the Li11–C2N/graphene bilayer. Different adsorption sites are indicated as CN1, CN2, CN3, GCN1, GCN2, and GCN3 for both structures. Reproduced with permission from Ref. [38]. d Top and side views of the Li adsorption site on the C3N/P heterostructure (Li/C3N/P, C3N/Li/P, and C3N/P/Li). HC and TN sites are on the outer surface of C3N, and HP site is on the outer surface of phosphorene, HCP, HNP, BCP, and BNP sites are in the interlayer of the C3N/P heterostructure. Reproduced with permission from Ref. [64]. e Lithium migration pathway and corresponding energy profile through Path II of the interlayer of C3N/Blue P heterostructure. Reproduced with permission from Ref. [65]. f Adsorption energy for S8 cluster and LiPSs on C4N4 monolayer (bars without patterns) and graphene (bars with patterns), respectively. The insets on the pillars show S8 or Li2Sn/C4N4 structures generated by the principle of minimum energy. Reproduced with permission from Ref. [56]. Copyright permissions from Elsevier, American Chemical Society and Royal Society of Chemistry. (Color figure online)

