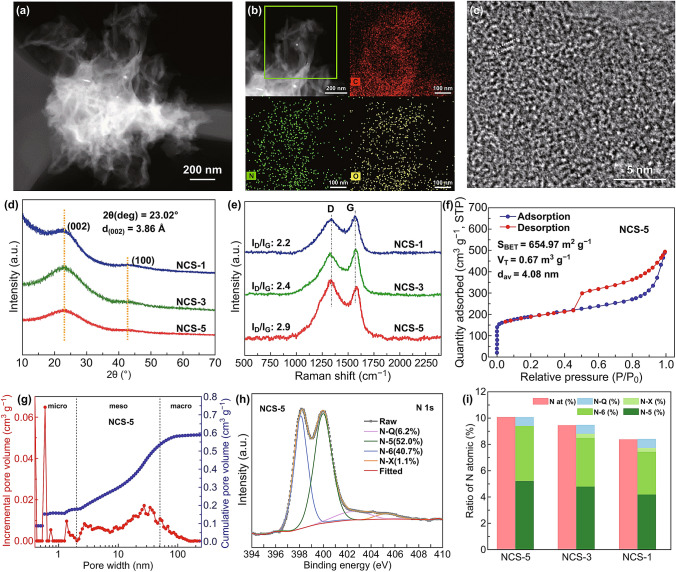
Fig. 3.
Structural and compositional characterization of selected NCSs. (a) HAADF image of NCS-5. (b) HAADF image and corresponding EDS elemental mapping of NCS-5. (c) HRTEM image of NCS-5. (d) XRD patterns of NCSs. (e) Raman spectra NCSs. (f) Nitrogen adsorption–desorption isotherms of NCS-5. (g) Pore size distribution of NCS-5. (h) High-resolution N 1s spectra of NCSs. (i) Distributions of different types of N-doping in selected NCSs

