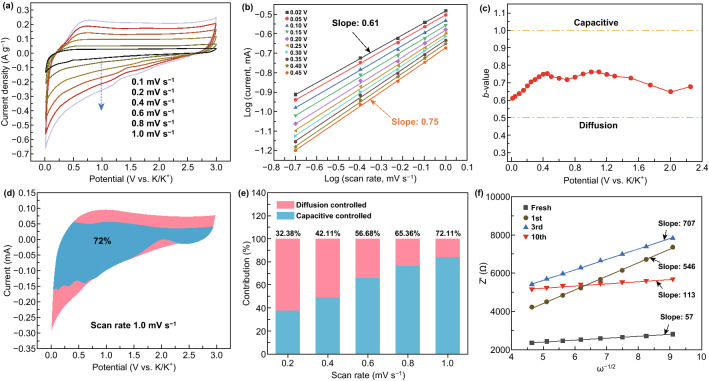
Fig. 5.
(a) CV curves of the NCS-5 anode at different scan rates in the voltage range of 0.01–3.0 V (vs. K+/K). (b) Derived relationship between peak current and scan rate in logarithmic format. (c) b-values plotted as a function of potential for the cathodic scan (K+ intercalation). (d) Separation of the capacitive and diffusion currents in the NCS-5 anode at a scan rate of 1.0 mV s−1. (e) Normalized contributions of capacitance and diffusion at different scan rates. (f) Relationship between Z′ and ω−1/2 in the low-frequency region

