
Figure 2.
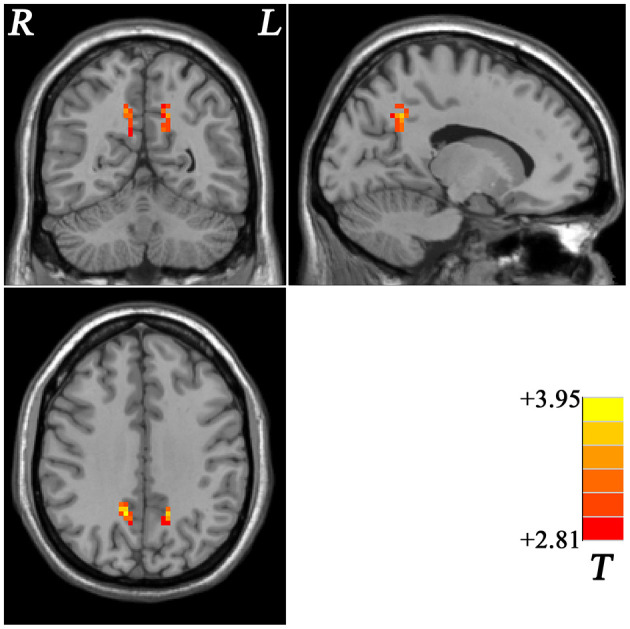
Statistical map depicts higher ReHo in GI group compared with non-GI group. The threshold was FDR (false discovery rate) corrected at p < 0.05. Red denotes higher ReHo in the GI group. Th color bar indicates T values from post-hoc t-tests. L, lest side; R, right side; GI, gastrointestinal, ReHo, regional homogeneity.