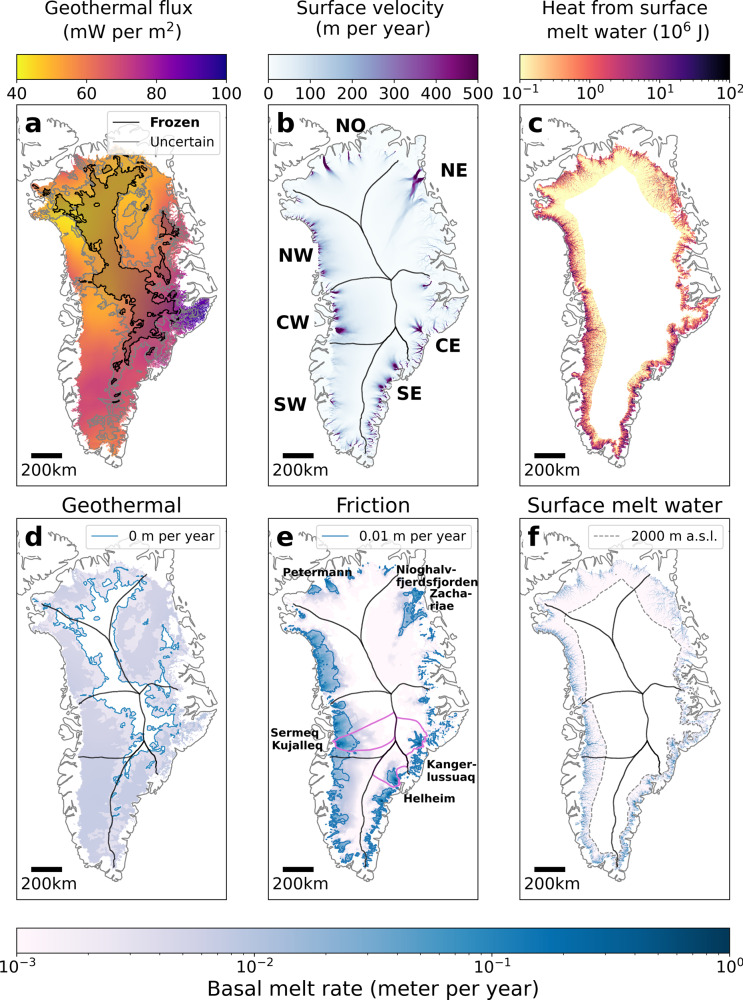
Fig. 1. Heat sources and resulting basal melt rates.
a Mean geothermal flux from25–27. The shaded areas outline where bed conditions are likely frozen (black) or uncertain (grey) based on radar observations and numerical ice-flow models28. b Surface velocities from multi-year MEaSURES dataset15. c Heat generated by surface melt-water infiltration. d Basal melting from geothermal heating. Blue contours outline the 0 m per year extent. e Basal melting from frictional heating. Purple outlines show the glacial catchments of Sermeq Kujalleq, Kangerlussuaq and Helheim Glacier55. Blue contours outline the 10−2 m per year extent. f Basal melting from surface water heating. Dashed grey contours outline the 2000 m above sea level elevation. d–f have the same logarithmic scalebar.

