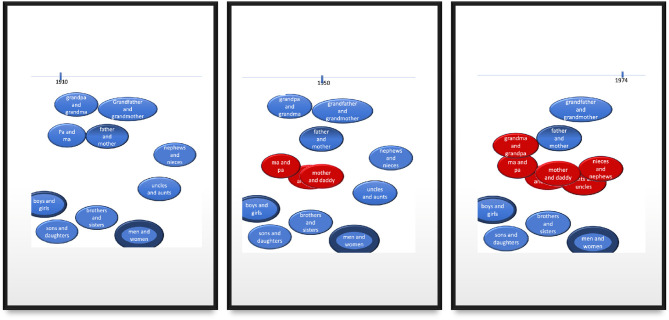
Figure 6.
The three panels capture simplified snapshots of historical change for a handful of representative items. Blue circles represent a bias toward male-first order, while red circles represent a bias for female-first order. The thickness of the circles indicates their relative token frequencies (in either order).

