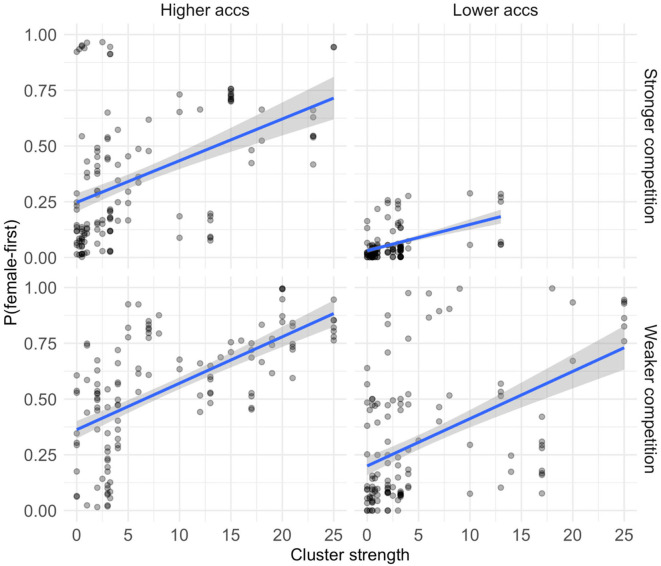
Figure 7.
Scatterplots depicting the correlation of cluster strength on the probability of female-first order in the following decade, plotted separately for stronger and weaker competition and for higher and lower relative accessibility of the female term. Data is separated along the median values for both competition (log frequency of male-first order) and relative accessibility. Log-frequency of the binomials to capture the interaction between frequency and cluster strength.

