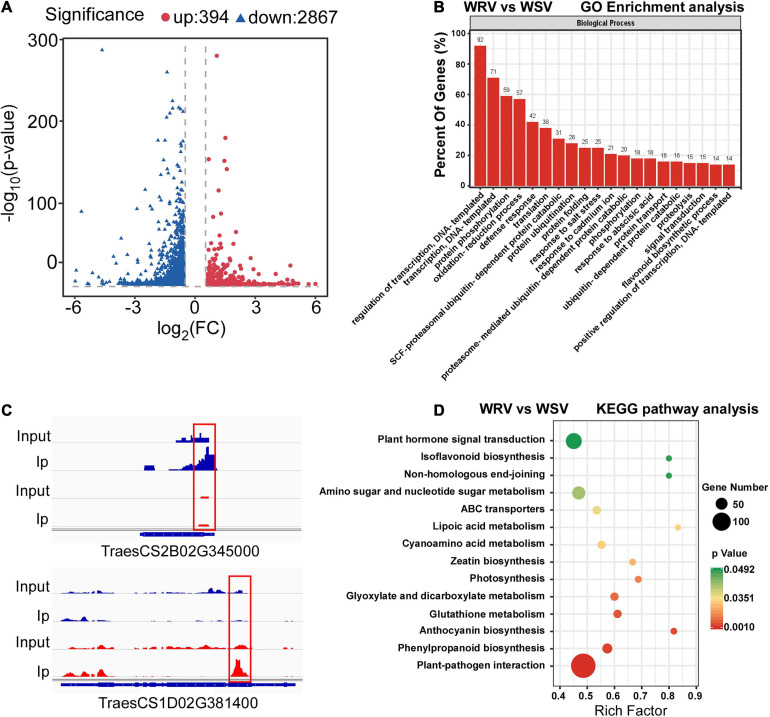
FIGURE 2.
Global m6A modification changes in two WYMV-infected varieties and functional analysis of genes with m6A. (A) Identification of 394 hyper-methylated and 2867 hypo-methylated m6A peaks in the WRV group compared with the WSV group that showed a significant increase or decrease in m6A methylation (fold change >1.5, p < 0.05). (B) Examples of hyper-methylated and hypo-methylated genes with differential m6A peaks. The blue peaks represent the IP and Input reads from the WRV group, and the red peaks represent the IP and Input reads from the WSV group. The red boxes represent m6A peaks. (C) Gene Ontology analysis of biological processes of differentially methylated genes (DMGs). The vertical axis represents the proportion of DMGs enriched in each pathway. (D) KEGG pathway enrichment analysis of the DMGs. The horizontal axis represents the rich factor of each pathway.

