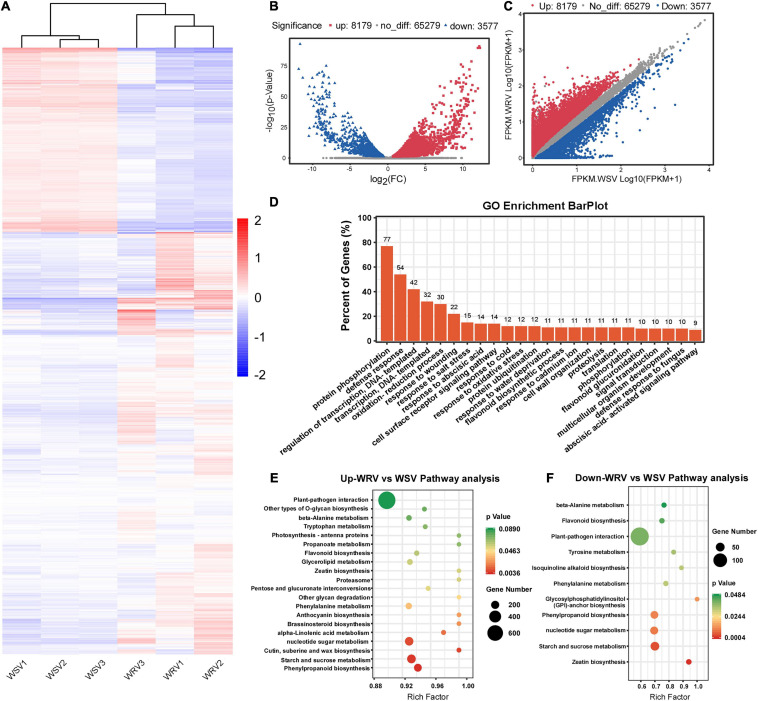
FIGURE 3.
Overview of differentially expressed genes in the WRV group compared with the WSV group by RNA-seq and functional analysis of differentially expressed genes. (A) Heat map of RNA-seq data of WRV and WSV samples. Rows, mRNAs; columns, WRV samples and WSV samples. Red, white, and blue represent upregulation, unchanged expression, and downregulation of mRNA levels, respectively. (B) Volcano analysis of differentially expressed genes. (C) Scatter plot of differentially expressed genes. FPKM, fragments per kilobase of exon model per million mapped reads. (D) Gene Ontology analysis of the biological processes of differentially expressed genes. The vertical axis represents the proportion of differentially expressed genes enriched in each pathway. (E,F) KEGG pathway enrichment analysis of the upregulated and downregulated genes, respectively. The horizontal axis represents the rich factor of each pathway.

