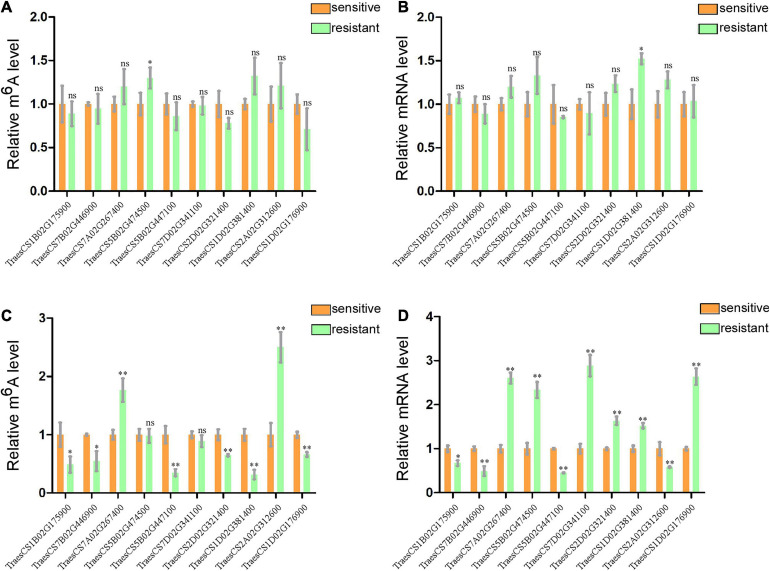
FIGURE 5.
Gene-specific m6A/normal qPCR assays. (A) m6A IP qPCR validation of m6A methylation level of 10 randomly selected genes from Table 1 in two healthy wheat variety plants. (B) Relative mRNA levels of the 10 genes were detected via real-time qPCR in two healthy group plants. (C) m6A methylation level of 10 randomly selected genes in WRV and WSV group respectively. (D) Relative mRNA expression level of 10 genes in WRV and WSV group plants. The levels of the 10 genes in the sensitive variety group were normalized to 1. Statistical analyses were performed using the Student’s t-test. Asterisks indicate a significant difference when compared to the control. *p < 0.05; **p < 0.01.

