. 2021 Jul 5;31(7):410–416. doi: 10.2188/jea.JE20200181

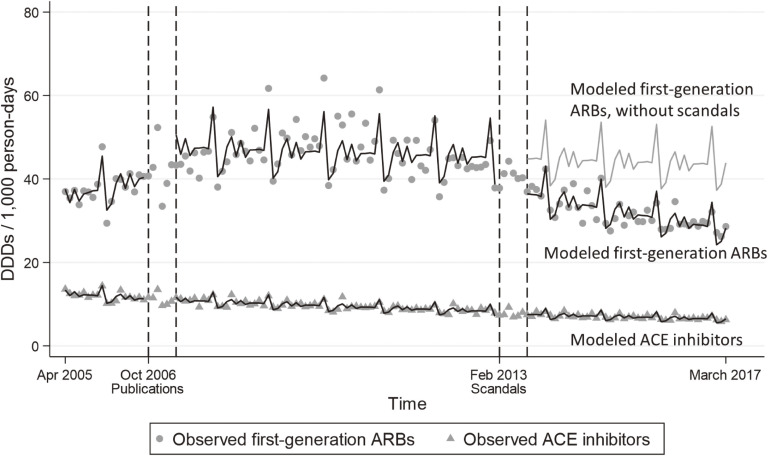
Figure 1. Changes in the use of first-generation ARBs and ACE inhibitors. This figure shows changes in the use of first-generation ARBs and ACE inhibitors (DDDs/1,000 persons) before and after the publication of clinical-trial results, and also before and after the occurrence of the scandals. The black lines indicate the modeled values for the use of first-generation ARBs and ACE inhibitors, according to the generalized estimating equation that is shown in eMaterials 1, which includes adjustment for seasonality. The grey line indicates the modeled values for the use of first-generation ARBs, supposing that there had been no scandals. The transient increase at the end of every calendar year is most likely caused by hospitals buying drugs just before the long new-year’s holiday, and it appears to be offset by a transient decrease of similar magnitude at the start of the following calendar year.

Figure 1.