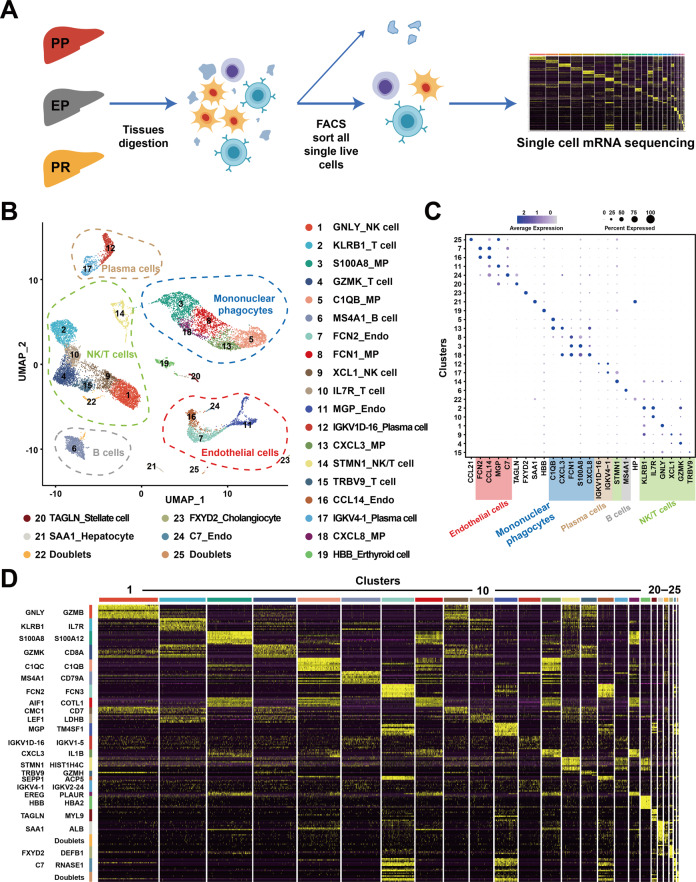
Fig. 1. Overview of scRNA-seq from samples in liver transplantation.
A Workflow of tissue collection, sample processing, and data acquisition. Collect samples from three-time points, PP, EP, and PR, for tissue digestion. Next, sort live cells by FACS and construct cDNA libraries, then perform high-throughput sequencing and downstream analyses. B UMAP visualization of all cells (14,313) in 25 clusters. Each dot represents one cell, with colors coded according to the different clusters. Clusters are named by the most specific and highly expressed genes. MP mononuclear phagocytes, Endo endothelial cells. C Dot plots showing the most highly expressed marker genes (x-axis) of major cell types (y-axis) in Fig. 1B. The color of the dots represents the level of gene expression while the size of the dot represents the percentage of cells expressing the gene. D Heatmap of top ten differentially expressed genes between different clusters. The line is colored according to clusters in Fig. 1B. Each cluster lists the top two genes shown on the left.

