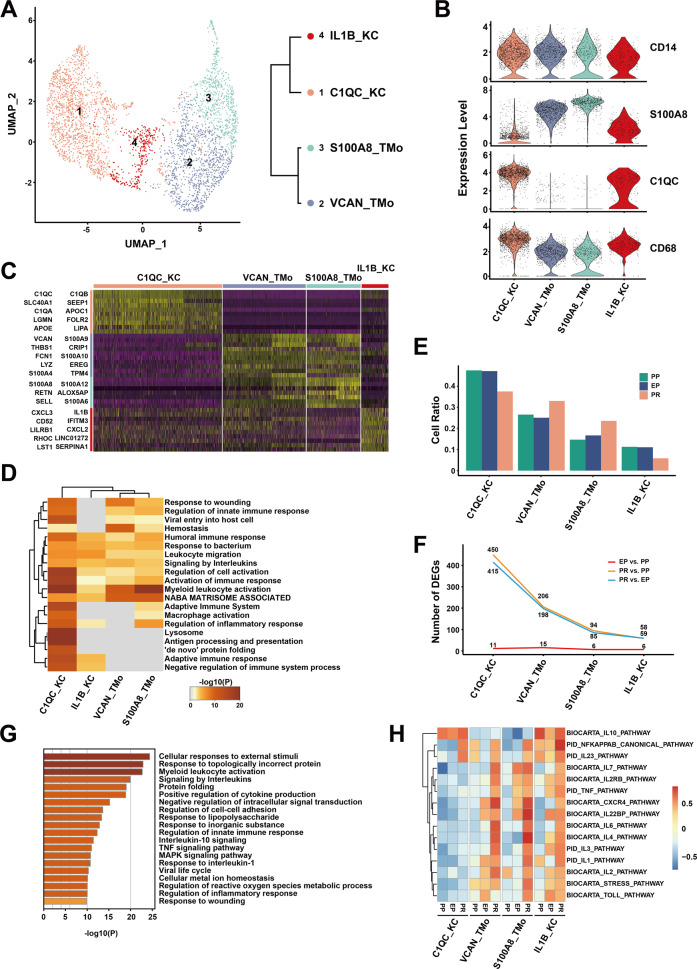
Fig. 2. scRNA-seq of mononuclear phagocytes in liver transplantation.
A UMAP plot showing four mononuclear phagocyte clusters (3622 cells) in liver transplantation, colored according to different clusters (left panel). Dendrogram of four clusters by the hierarchical clustering analysis based on their normalized mean expression values (right panel). B Violin plots showing the normalized expression of CD14, S100A8, C1QC, and CD68 genes (y-axis) for TMo and KC clusters (x-axis). C Heatmap of top ten differentially expressed genes between different mononuclear phagocyte clusters. The line is colored according to clusters in Fig. 2A. D Gene Ontology enrichment analysis results of mononuclear phagocyte clusters. Only the top 20 most significant GO terms (p value < 0.05) are shown in rows. E Cell ratio of different mononuclear phagocyte clusters in PP, EP, and PR samples. F Number of upregulated DEGs between different timepoint samples in different mononuclear phagocyte clusters. G Gene Ontology enrichment analysis results of upregulated DEGs in C1QC_KC cluster after reperfusion (PR vs. EP). Only the top 20 significant GO terms (p value < 0.05) are shown in rows. H The gene set variation analysis (GSVA) showing the pathways (PID and BIOCARTA gene sets) with significantly different activation in different samples of mononuclear phagocyte clusters. Different colors represent different activation scores.

