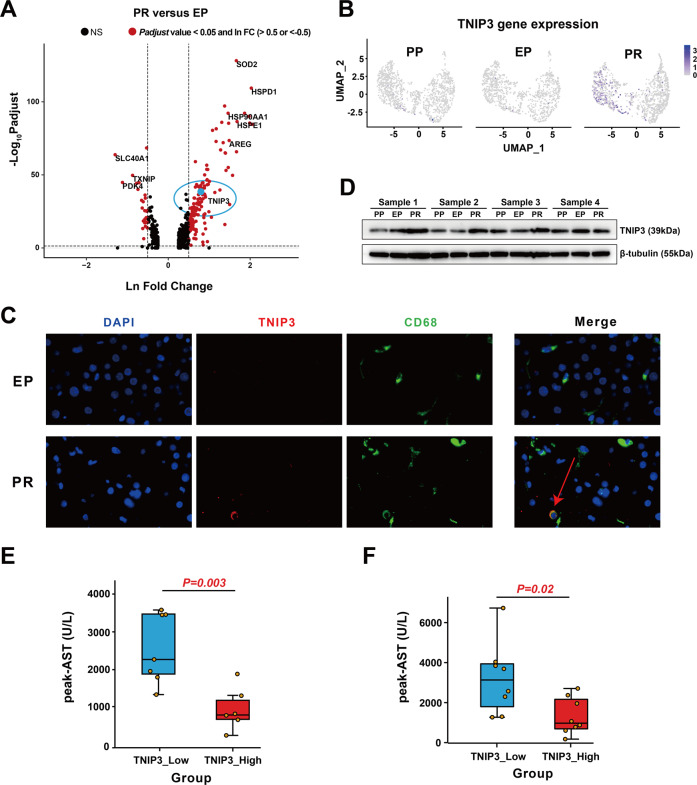
Fig. 3. TNIP3 expression is specifically increased in KC clusters after IRI.
A Volcano plot shows the DEGs of PR vs. EP in the C1QC_KC cluster. The red dots represent p adjust value less than 0.05 and lnFC greater than 0.5 or less than −0.5, the blue dot represents TNIP3, and the rest are black dots. B Feature plots showing the normalized expression of TNIP3 in mononuclear phagocyte clusters of PP, EP, and PR. Color represents the level of gene expression. C Immunofluorescence showed that the expression of TNIP3 (red), CD68 (green), and DAPI (purple) in EP and PR samples. CD68+ TNIP3+ cells only appeared in partly cells in the PR sample. D Western Blot results showed that the expression of TNIP3 in PR samples was higher than that in the EP and PP samples. E The postoperative peak-AST level in the TNIP3_low group was higher than the TNIP3_high group (n = 13, 880 vs. 2506 U/L, p = 0.003) according to bulk RNA-seq data analysis results, each point represents a patient. F The postoperative peak-AST level in the TNIP3_low group was higher than the TNIP3_high group (n = 16, 1316 vs. 3216 U/L, p = 0.02) according to the RT-PCR results of 16 pairs of liver samples.

