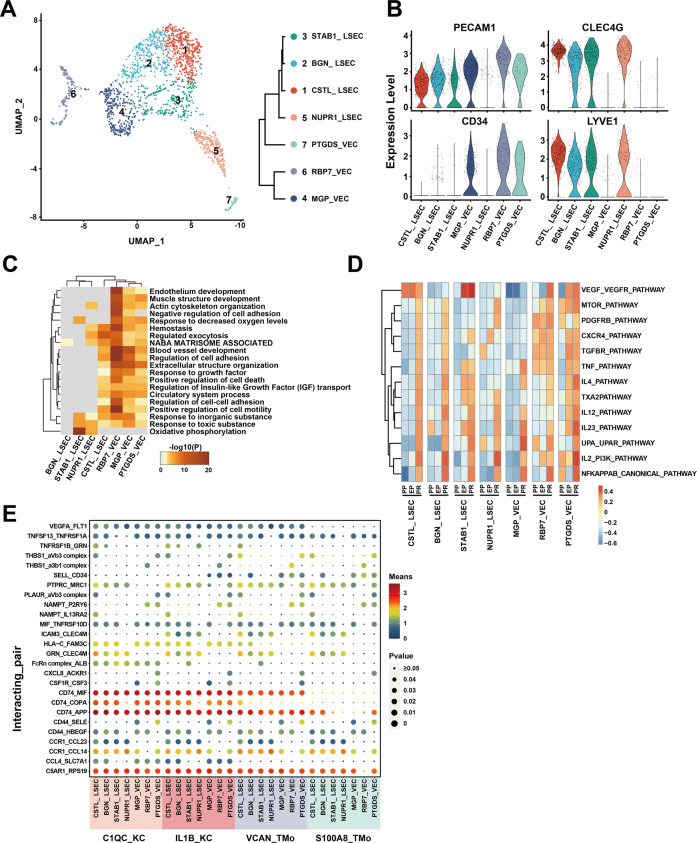
Fig. 4. scRNA-seq of endothelial cells in liver transplantation.
A UMAP plot showing seven endothelial cell clusters in liver transplantation, colored according to different clusters (left panel). Dendrogram of seven clusters by hierarchical clustering analysis based on their normalized mean expression values (right panel). B Violin plots showing the normalized expression of PECAM1, CLEC4G, CD34, and LYVE1 genes (y-axis) for endothelial cell clusters (x-axis). C Gene Ontology enrichment analysis results of endothelial cell clusters. Only the top 20 most significant GO terms (p value < 0.05) are shown in rows. D GSVA showing the pathways (PID gene sets) with significantly different activation in different samples of endothelial cell clusters. Different colors represent different activation scores. E Cell–cell interaction analysis between mononuclear phagocyte clusters and different endothelial cell clusters in PR samples. Ligand–receptor pairs are labeled in y-axis. The size of the circle represents the level of p value while different colors represent different means value. Ligands come from mononuclear phagocyte clusters, and receptors come from endothelial cell clusters.

