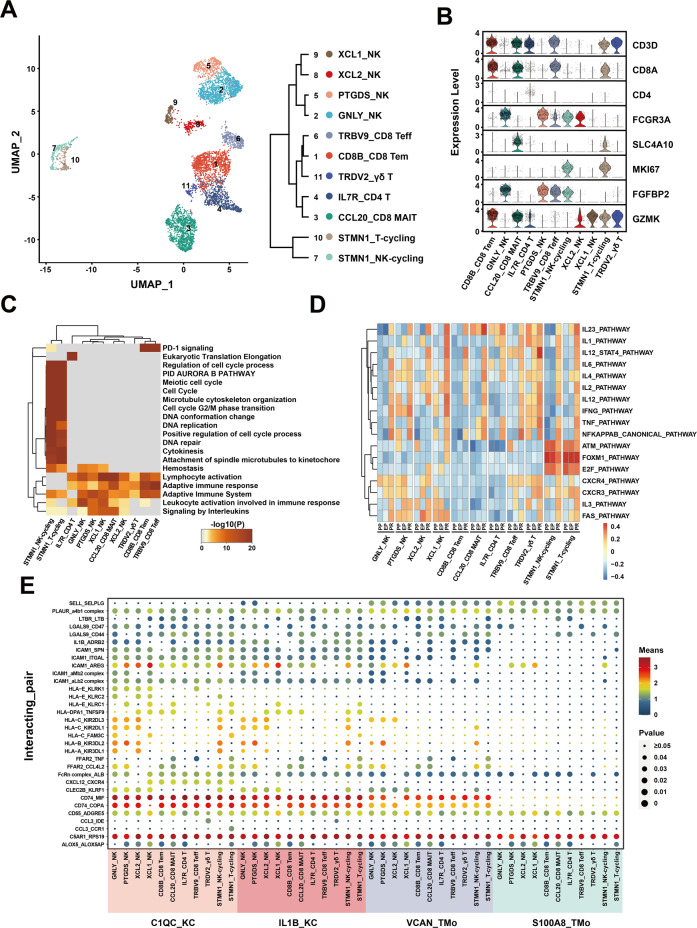
Fig. 5. scRNA-seq of NK/T cells in liver transplantation.
A UMAP plot showing 11 NK/T cell clusters in liver transplantation, colored according to different clusters (left panel). Dendrogram of 11 clusters by the hierarchical clustering analysis based on their normalized mean expression values (right panel). B Violin plots showing the normalized expression of marker genes (y-axis) for NK/T cell clusters (x-axis). C Gene Ontology enrichment analysis results of NK/T cell clusters. Only the top 20 most significant GO terms (p value < 0.05) are shown in rows. D GSVA showing the pathways (PID gene sets) with significantly different activation in different samples of NK/T cell clusters. Different colors represent different activation scores. E Cell–cell interaction analysis between mononuclear phagocyte clusters and different NK/T cell clusters in PR samples. Ligand–receptor pairs labeled in y-axis. The size of the circle represents the level of p value, and different colors represent different means values. Ligands come from mononuclear phagocyte clusters, and receptors come from NK/T cell clusters.

