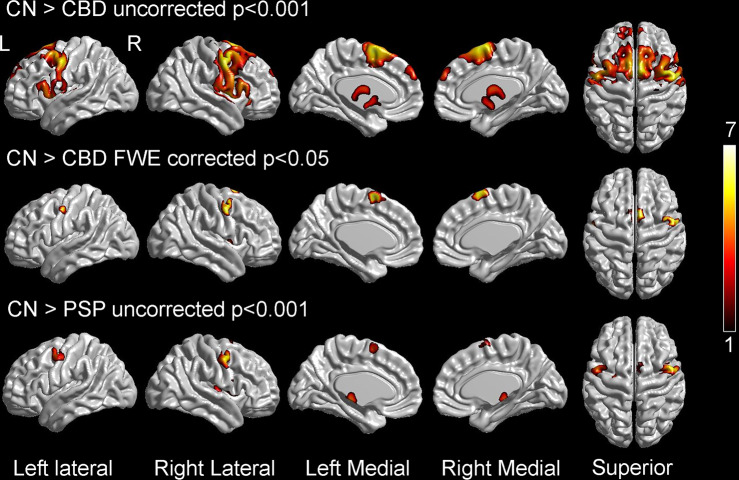
Fig. 3. Voxel-level FDG-PET findings at baseline.
The top two rows show regions of hypometabolism in progressive apraxia of speech patients with corticobasal degeneration (CBD) compared to controls, either uncorrected for multiple comparisons at p < 0.001 (top) or after correction for multiple comparisons using family-wise error (FWE) correction at p < 0.05 (middle). The bottom row shows regions of hypometabolism in progressive apraxia of speech patients with progressive supranuclear palsy (PSP) compared to controls shown uncorrected for multiple comparisons at p < 0.001. Statistical comparisons were performed using two-sided t-tests in SPM12. Color scale reflects T score. Results are shown on three-dimensional brain renderings using BrainNet Viewer.

