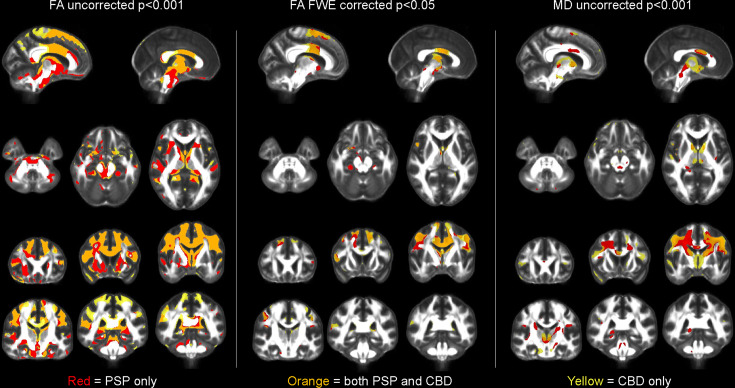
Fig. 4. Diffusion tensor imaging findings at baseline.
The left two panels show regions with decreased fractional anisotropy (FA) compared to controls, either uncorrected for multiple comparisons at p < 0.001 (left) or after correction for multiple comparisons using family-wise error (FWE) correction at p < 0.05 (middle). The right panel shows regions with increased mean diffusivity (MD) compared to controls shown uncorrected at p < 0.001. Results for progressive apraxia of speech patients with progressive supranuclear palsy (PSP) are shown in red, results for progressive apraxia of speech patients with corticobasal degeneration (CBD) are shown in yellow, and regions of overlap between the two groups are shown in orange. Statistical comparisons were performed using two-sided t-tests in SPM12.

