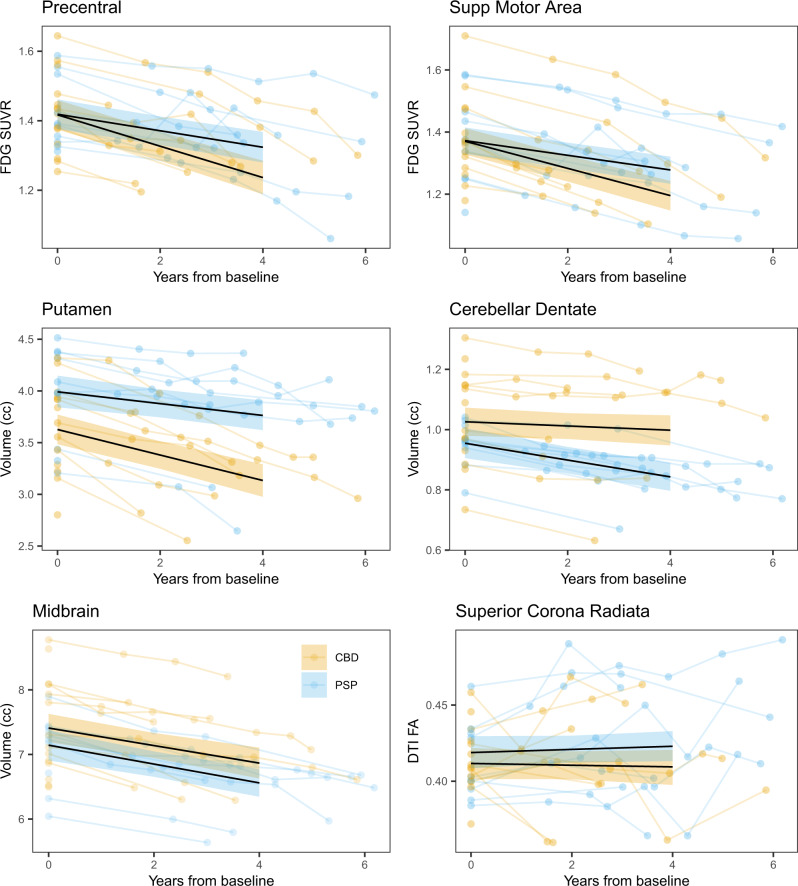
Fig. 5. Trajectories of decline in regional FDG-PET metabolism, MRI volume, and DTI-fractional anisotropy by pathology.
Trajectories are shown for progressive apraxia of speech patients with corticobasal degeneration (CBD) or progressive supranuclear palsy (PSP) pathology. Median posterior fits of the Bayesian hierarchical models using baseline as the timescale anchor are shown as black lines, with 90% posterior intervals colored by pathological diagnosis for six selected regions, results averaged across hemispheres, across the three neuroimaging modalities. The data used to fit the model are underlaid, again colored by diagnosis, and averaged across hemispheres, with scans from an individual connected by line segments. Fitted values extend to four years, the median time from baseline to death in the CBD group, and where we have a majority of our data across both diagnosis groups. Precentral cortex = motor cortex. Source data are provided as a Source Data file.

