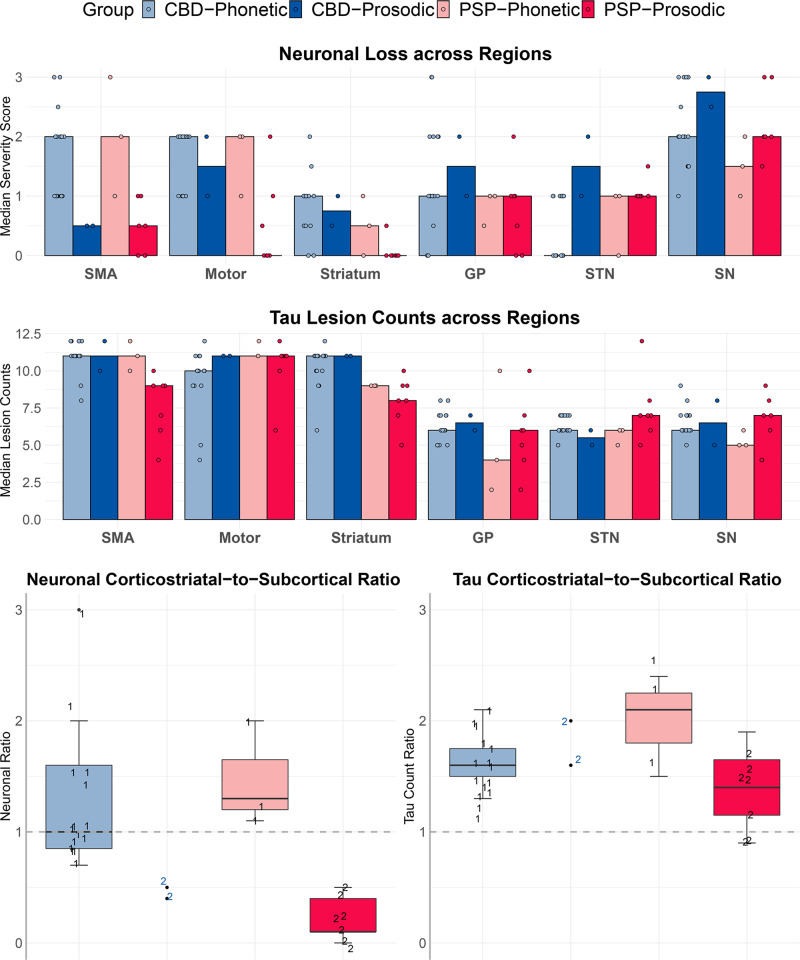
Fig. 6. Histograms of regional neuronal loss and tau counts by pathology and apraxia of speech subtype.
The top two histogram plots depict median neuronal loss severity or median total tau lesion count for each region, with all individual points shown. The bottom boxplots depict the ratio between corticostriatal regions (supplementary motor area (SMA), motor, striatum) and subcortical structures (globus pallidus (GP), subthalamic nucleus (STN), and substantia nigra (SN)) for both neuronal loss severity and tau lesion count. The phonetic patients are shown with the number 1 and the prosodic patients are shown with a number 2. Boxes represent lower quartile, median and upper quartile, with whiskers extending to the farthest point at most 1.5*inter-quartile range from each quartile. CBD corticobasal degeneration; PSP progressive supranuclear palsy. N = 15 CBD-phonetic cases; N = 2 CBD-prosodic cases; N = 3 PSP-phonetic cases; N = 7 PSP-prosodic cases. Source data are provided as a Source Data file.

