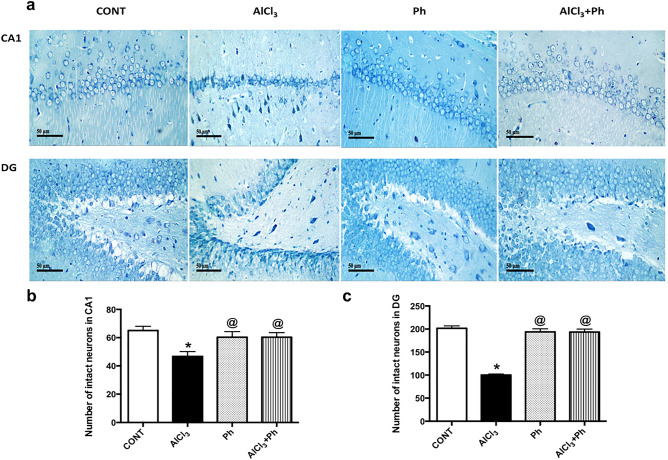
Figure 5.
Effect of P. harmala on AlCl3-induced neuronal loss in hippocampal CA1 and DG regions. (a) Representative images of Nissl staining across hippocampal CA1 and DG sections (scale bar 50 μm). The lower panel shows the effect of P. harmala treatment on the number of surviving neurons in hippocampal (b) CA1 and (c) DG regions. Values represent mean ± SD (n = 3). Statistical analysis was carried out by one-way ANOVA followed by Tukey’s Multiple Comparisons test. (*) Significantly different from CONT and (@) AlCl3 groups at p < 0.05; AlCl3 aluminum chloride, CONT control, CA1 cornu Ammonis 1, DG dentate gyrus, Ph Peganum harmala.

