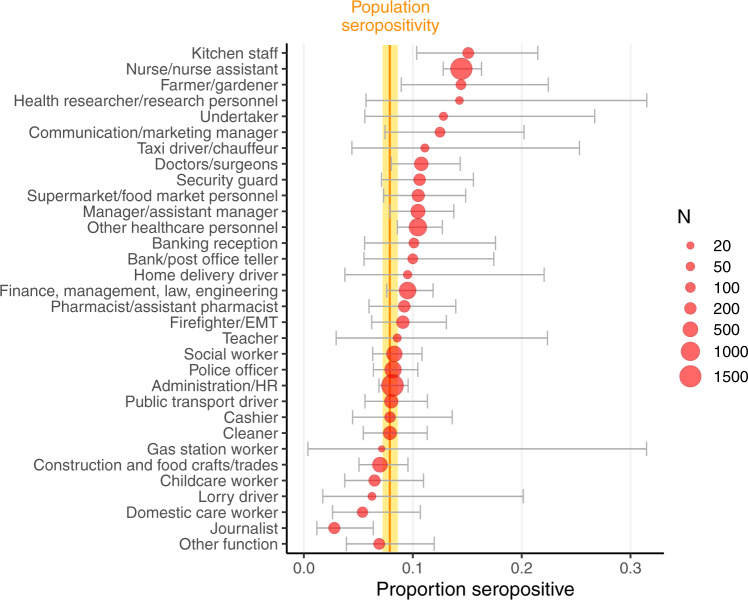
Fig. 2. Prevalence of anti-SARS-CoV-2 IgG antibodies by occupation, SEROCoV-WORK + study, May–September 2020, Geneva, Switzerland.
Sample size: 10,513 participants, 1026 of which were seropositive. Red dots indicate mean seropositivity rate for each occupation, while horizontal gray lines represent 95% binomial confidence intervals. Dot size indicates number of employees with that occupation. Vertical orange bar and yellow area indicate general working-age population seropositivity rate and 95% binomial confidence interval, respectively, from SEROCoV-POP study20,21.

