
Fig. 1. Transformation frequency as a function of genomic relatedness between strains.
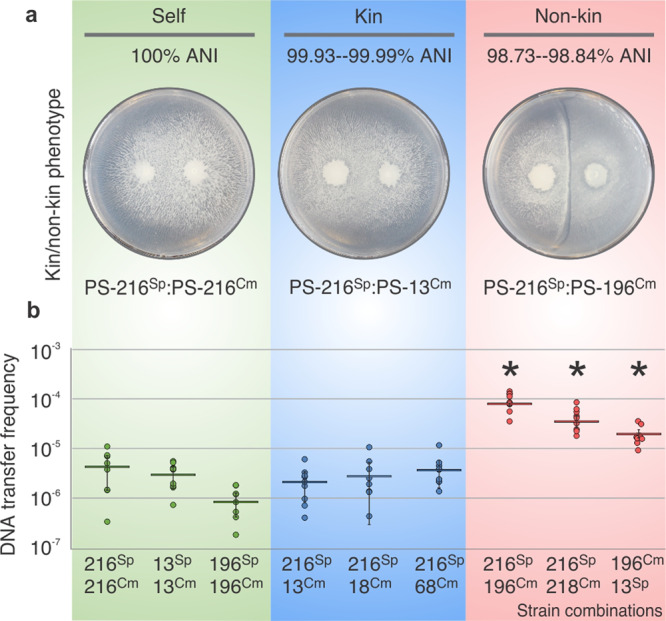
a Representative interactions of control self-interaction (green), kin interaction (blue) and non-kin interaction (red) (ANI indicated). b Transformation frequency as quantified by the frequency of double mutants isolated from the swarm boundary (n = 3 biologically independent experiments, each n performed in three technical replicates (9 data points), error bars represent SD). Asterisks represent statistically significant values compared to corresponding self and kin pairings (two tailed Student’s t-test for unpaired data assuming equal variances), (Supplementary Notes and Supplementary Fig. 2). Data are presented as mean values ± SD and error bars represent SD of the mean values (n = 3). For strain abbreviations see Table 2.