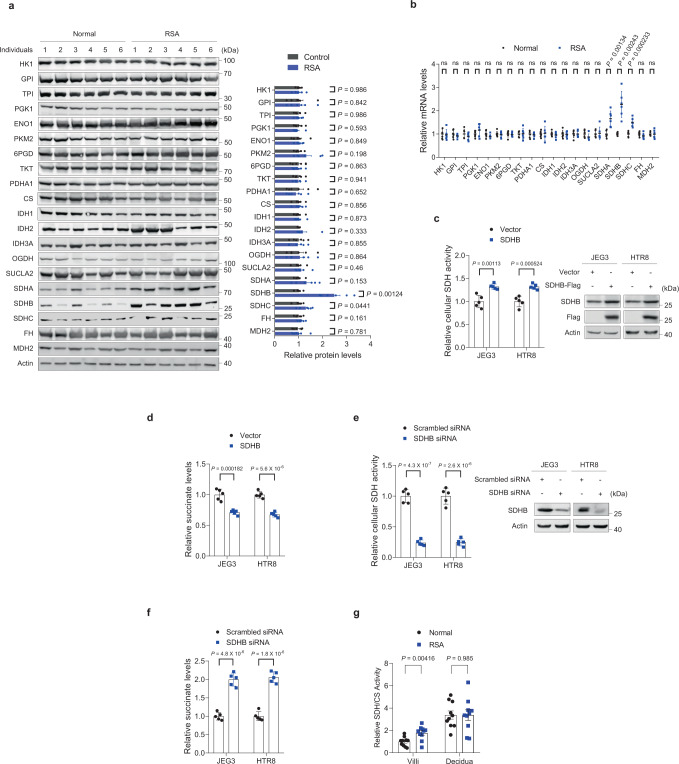
Fig. 1. Low villous SDHB expression reduces succinate accumulation and correlates with RSA.
a Western blot analysis of glycolysis and citrate cycle enzymes in villi from individuals with RSA or normal controls (n = 6 persons/group). Right panel: quantitative western blot results of six samples per group. b mRNA expression of glycolytic and citrate cycle genes in villi from individuals with RSA and normal controls (n = 6 persons/group). Exact P values in b are listed below: HK1 0.800, GPI 0.326, TPI 0.369, PGK1 0.202, ENO1 0.145, PKM2 0.685, 6PGD 0.715, TKT 0.914, PDHA1 0.691, CS 0.841, IDH1 0.546, IDH2 0.801, IDH3A 0.969, OGDH 0.163, SUCLA2 0.816, SDHA 0.00134, SDHB 0.00243, SDHC 0.000233, FH 0.222, and MDH2 0.938. c Relative SDH activities in SDHB-overexpressing JEG3 and HTR8 cells and control cells (n = 5 independent experiments). The SDHB overexpression efficiency is shown in the right panel. d Succinate levels in SDHB-overexpressing JEG3 and HTR8 cells and control cells (n = 5 independent experiments). e Relative SDH activities in SDHB-knockdown JEG3 and HTR8 cells and control cells (n = 5 independent experiments). The SDHB-knockdown efficiency is shown in the right panel. f Succinate levels in SDHB-knockdown JEG3 and HTR8 cells and control cells (n = 5 independent experiments). g The relative SDH activities in villi and decidua tissues from both RSA patients and normal controls (n = 10 persons/group). a–g Data represent the mean ± standard error; ns not significant, *P < 0.05, **P < 0.01, ***P < 0.001, ns not significant. Two-tailed unpaired Student’s t tests in a–g. Source data are provided as a Source Data file.

