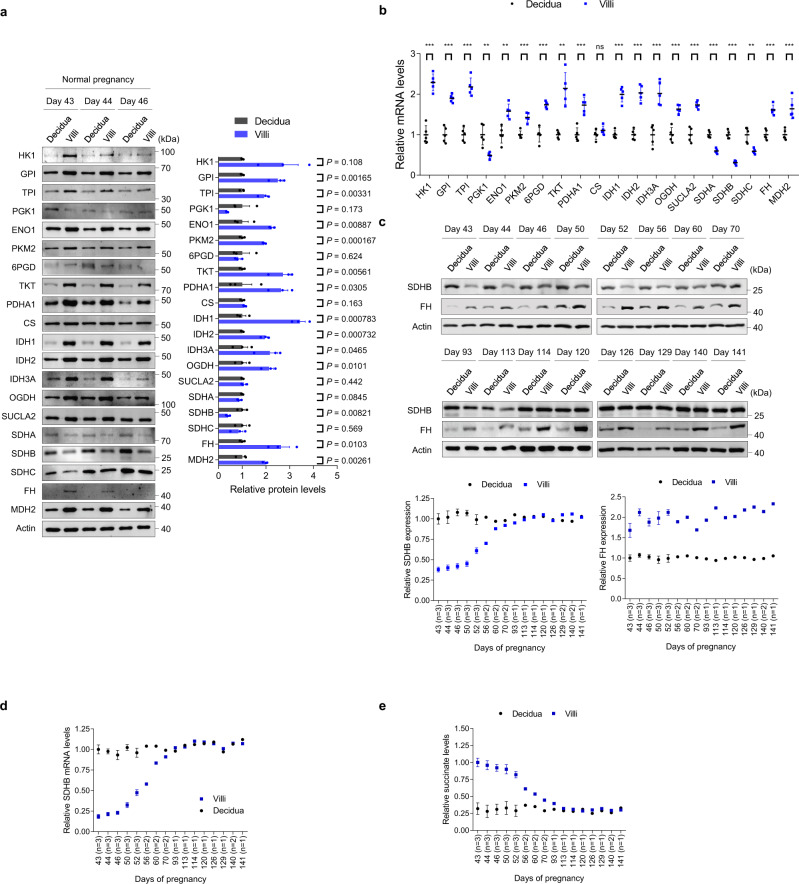
Fig. 2. Dynamic changes in SDHB regulate villous succinate levels and pregnancy progression.
a Western blot analysis of glycolysis and citrate cycle enzymes in villi (n = 3 biologically independent samples) and decidua (n = 3 biologically independent samples) from normal controls. The timing of pregnancy termination (day) is shown for each sample. Right panel: quantitative western blot results of three samples per group. b mRNA levels of glycolytic and citrate cycle genes (n = 5 persons). Exact P values in b are listed below: HK1 1.3 × 10⁻⁵, GPI 1.4 × 10⁻⁵, TPI 1.3 × 10⁻⁵, PGK1 0.00247, ENO1 0.00142, PKM2 0.000206, 6PGD 3.4 × 10⁻⁵, TKT 0.00225, PDHA1 0.000238, CS 0.164, IDH1 5.9 × 10⁻⁶, IDH2 8.5 × 10⁻⁶, IDH3A 0.000383, OGDH 0.000115, SUCLA2 2.8 × 10⁻⁵, SDHA 1.8 × 10⁻⁵, SDHB 6.4 × 10⁻⁷, SDHC 0.00162, FH 4.6 × 10⁻⁵, and MDH2 0.000902. c SDHB and FH expression during pregnancy progression. The timing of pregnancy termination (Day) is shown for each sample. Lower panel: quantitative western blot results. d SDHB mRNA levels in villi and decidua during pregnancy progression. e Succinate levels in villi and decidua during pregnancy progression. The number of samples at each pregnancy termination (n) is shown on the horizontal coordinate (c–e). a, b Data represent the mean ± standard error, *P < 0.05, **P < 0.01, ***P < 0.001, ns not significant. Two-tailed unpaired Student’s t tests in a, b. Source data are provided as a Source Data file.

