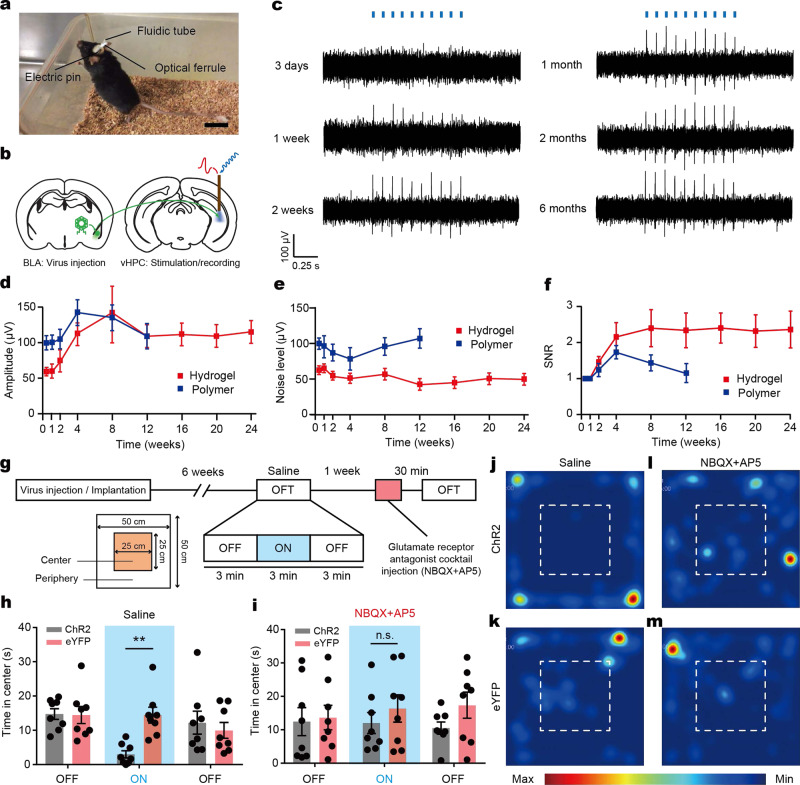
Fig. 3. Optogenetic interrogation by hydrogel hybrid probes.
a A photograph of a mouse implanted with the hydrogel hybrid probe. Scale bar: 2 cm. b An illustration of optogenetic modulation and electrophysiological recording in the BLA-to-vHPC projection circuit. c Representative electrophysiological recordings in the vHPC during optical stimulation (10 Hz, 10 mW mm−2, 5 ms pulse width) using the hydrogel hybrid probes 3 days, 1–2 weeks, and 1–6 months following implantation and transfection with AAV5-CaMKIIα::ChR2-eYFP. d–f Amplitude of optically-evoked potentials (d) and background noise (e), and signal-to-noise ratio (SNR) (f) in the opto-electrophysiological experiments recorded from the hydrogel hybrid probes (red) and the polymer probes (blue) at various time point (n = 8 for each). g A summary of the behavioral assays performed in this study. Open field tests (OFT) are performed (3 min light OFF/ON/OFF epoch) 6 weeks following the injection of AAV5-CaMKIIα::ChR2-eYFP or AAV5-CaMKIIα::eYFP. Time spent in the center region of the OFT arena during optical stimulation (20 Hz, 10 mW mm−2, 5 ms pulse width) is analyzed for trials conducted with the injections of saline solution or glutamate receptor antagonist cocktail (NBQX + AP5). Optical stimuli and drug injections are delivered into the vHPC via the hydrogel hybrid probes. h Time spent in the center in the absence or presence of optical stimulation following injection of saline solution (two-way ANOVA and Bonferroni multiple comparison test, p = 0.0031) i Time spent in the center in the absence or presence of optical stimulation following injection glutamate receptor antagonist cocktail (two-way ANOVA and Bonferroni multiple comparison test, p > 0.9999). j–m Representative heat map images tracing the position of mice transfected with ChR2 (j, l) and eYFP (k, m) control with injection of saline solution (j, k) and glutamate receptor antagonist cocktail (l, m). Dashed line indicates the center region of the open field arena. Values in d–f, h, i represent the mean and the standard deviation (n = 8).

