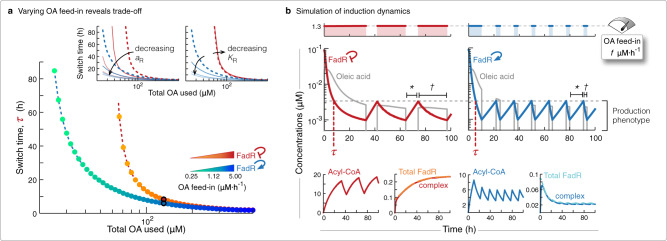
Fig. 2. Tuning inducer feed-in and control circuit to optimise induction process performance.
a Plot of the two performance objectives for logarithmic increases in OA feed-in flux from 0.38–5 μM⋅h−1, of the circuits with NAR (yellow to red dots) and PAR (green to blue dots). Inset plots show how these curves approach a limit when decreasing control circuit FadR promoter strength aR and affinity to bind its own promoter KR, from 100% (dashed lines) to 1% (lighter lines) of their nominal values in Supplementary Table 2. Red curves for system with NAR and blue curves for system with PAR. b Simulations of intermittent inductions of OA, at feed-in flux 1.3 μM⋅h−1 (top plots) to retain the production phenotype (middle plots), for the circuits with native NAR (left plots, red curves) and engineered PAR (right plots, blue curves). See Methods section for induction programme details. We plot availability of OA and dynamic response of FadR (middle plots), and dynamic responses of acyl-CoA, complex, and total FadR (free FadR + complex) (bottom plots). We calculate two induction process performance objectives from these simulations: total OA used (total shaded region in top plots) and switch time (τ in middle plots). Asterisk and dagger in middle plots highlights the time length of subsequent recovery and induction periods.

