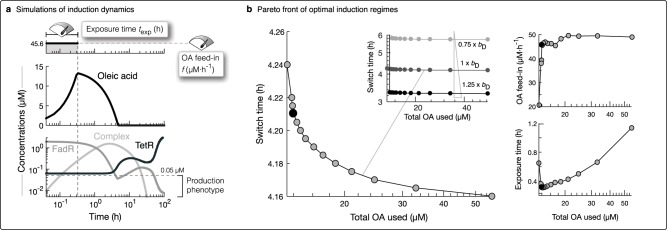
Fig. 4. Tuning induction and irreversible switch to minimise inducer use and switch time.
a Simulation of induction with its two tuning dials OA feed-in flux (f) and time length of exposure () fixed at f = 45.6 μM⋅h−1 and = 0.31 h (top plot). We plot the corresponding dynamic response of oleic acid, free FadR, complex and TetR, over 100 hours of the induction process, also indicating the maximum concentration of FadR of 0.05 μM for which we define the cell to be expressing the production phenotype. b Plot of the Pareto front of the induction performances achieved (left plot) for optimal feed-in flux and exposure times (right plots), as found from evaluating the multi-objective optimisation problem. The inset plot shows that increasing FadD expression leakiness by as little as 25% bD can further reduce the switch time with little affect on total OA used.

