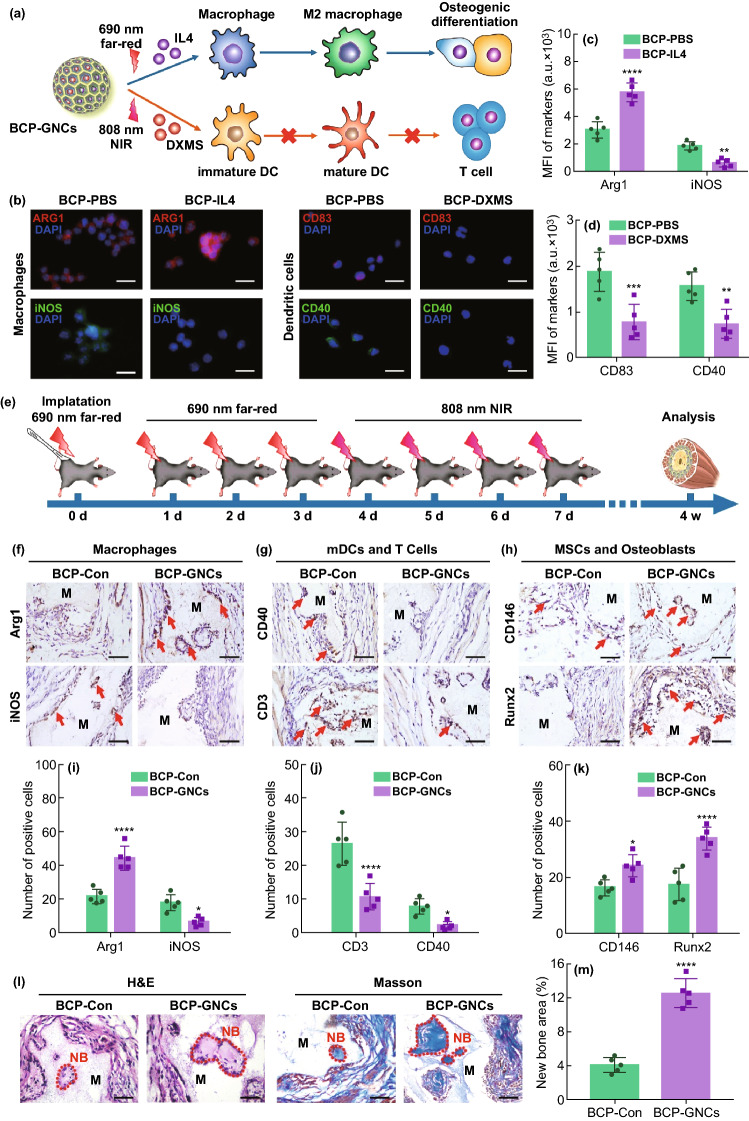
Fig. 5.
a Schematic diagram of BCP-GNCs-mediated macrophage polarization and DC maturation by releasing IL-4 and DXMS. b IF staining of Arg1 (red) and iNOS (green) of macrophage, CD83 (red) and CD40 (green) of DC and nuclei (blue) after macrophages or DCs seeded on the BCP with 690 nm far-red or 808 nm NIR stimulating the release of PBS (BCP-PBS), 690 nm far-red stimulating the release of IL-4 (BCP-IL4) or 808 nm NIR stimulating the release of DXMS (BCP-DXMS) for 24 h. Scale bar = 5 μm. c, d Semiquantification of positively stained cells in (b). n = 5, **P < 0.01, ***P < 0.001. e Flowchart of time course for irradiating BCP-GNC in vivo. f–h IHC staining of M1, M2 macrophages (iNOS and Arg1), mature DCs (CD40), T cells (CD3), MSCs and osteoblasts (CD146, Runx2) under the BCP-GNCs implant in vivo. Scale bar = 100 μm. Red arrow, positive cells. M, material. i–k Semiquantification of positively stained cells in (E, F, G). n = 5, *P < 0.05, **P < 0.01, ****P < 0.0001. l H&E and Masson staining of implant area of BCP-Con and BCP-GNCs in vivo after 4 weeks (4 W) (the red dash line shows the new bone formation area; NB, new bone; M, material). m Semiquantification of new bone area in (k). n = 5, ****P < 0.0001

