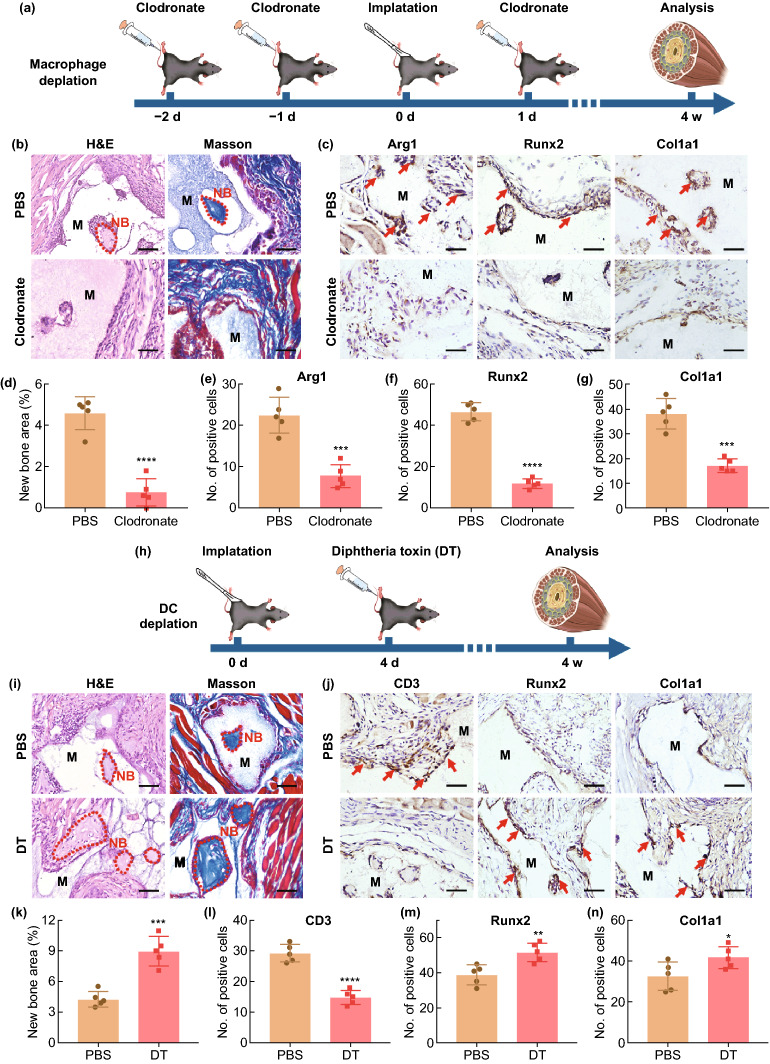
Fig. 6.
a Implementation strategy of clodronate on macrophages depletion. b H&E and Masson staining of BCP implant area treating with PBS or clodronate in vivo after implant 4 weeks (the red dash line shows the new bone formation area; NB, new bone; M, material). Scale bar = 100 μm. c IHC staining of M2 macrophages (Arg1) and osteoblasts (Runx2, Col1a1) under the BCP implant treating with PBS or clodronate in vivo. Scale bar = 100 μm. Red arrow, positive cells. M, material. d–g Semiquantification of new bone area and positively stained cells in (b, c). n = 5, ***P < 0.001, ****P < 0.0001. h Implementation strategy of diphtheria toxin (DT) on DCs depletion. i H&E and Masson staining of BCP implant area treating with PBS or DT in vivo after implant 4 weeks (the red dash line shows the new bone formation area; NB, new bone; M, material). Scale bar = 100 μm. j IHC staining of T cells (CD3) and osteoblasts (Runx2, Col1a1) under the BCP implant treating with PBS or DT in vivo. Scale bar = 100 μm. Red arrow, positive cells. M, material. k–n Semiquantification of new bone area and positively stained cells in (i, j). n = 5, *P < 0.05, **P < 0.01, ***P < 0.001, ****P < 0.0001

