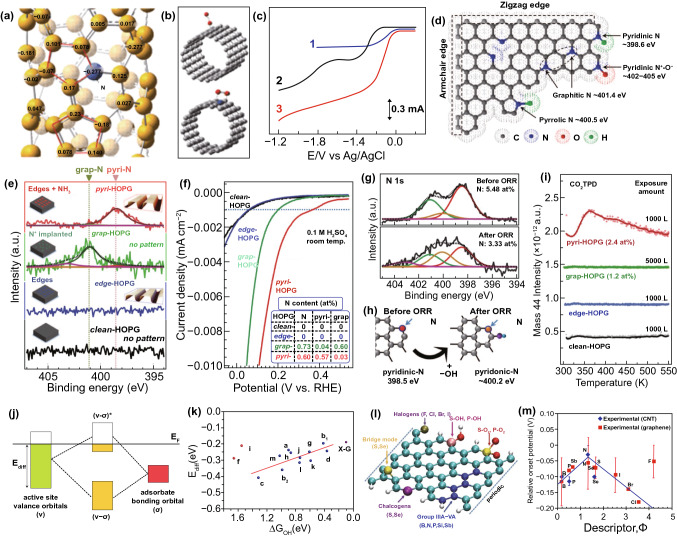
Fig. 2.
Heteroatom-doped nanocarbon catalysts for ORR. a Calculated charge density distribution of the N-doped CNTs; b schematic illustrations of two possible adsorption modes of O2 molecule at the pristine CNTs (top) and N-doped CNTs (bottom); c LSV curves for the prepared samples in air-saturated 0.1 M KOH for Pt/C (curve 1), VACCNT (curve 2), and VA-NCNT (curve 3) catalysts. Reproduced with permission from Ref. [3]. Copyright 2009, AAAS. d Schematic illustration of the commonly doped N species in carbon nanomaterials and the corresponded XPS binding energies. Reproduced with permission from Ref. [76]. Copyright 2015, AAAS. e, f N 1s XPS spectra and the corresponded LSV curves of the electrocatalysts; the inset of f is the N contents of the catalysts; g N 1s XPS spectra of the N-HOPG catalyst before and after ORR testing, respectively; h schematic illustrations of the formation of pyridinic-N by the attachment of OH to the carbon atom next to pyridinic-N. i CO2-TPD results for the four kinds of HOPG model catalysts. Reproduced with permission from Ref. [6]. Copyright 2016, AAAS; j scheme of orbital hybridization between the valance band of the doped carbon and the bonding orbital of adsorbates; k the relationship between ΔGOH* and Ediff for various doped graphene (X–G) active sites; note that the red points were not fitted. Reproduced with permission from Ref. [81]. Copyright 2014, American Chemical Society. l Schematic of various heteroatoms doped graphene nanoribbons. m Experimentally measured relative onset potential to that of Pt/C catalyst, as a function of descriptor (Φ) for p-element-doped carbon materials. Reproduced with permission from Ref. [58]. Copyright 2015, Wiley–VCH

