Fig. 4.
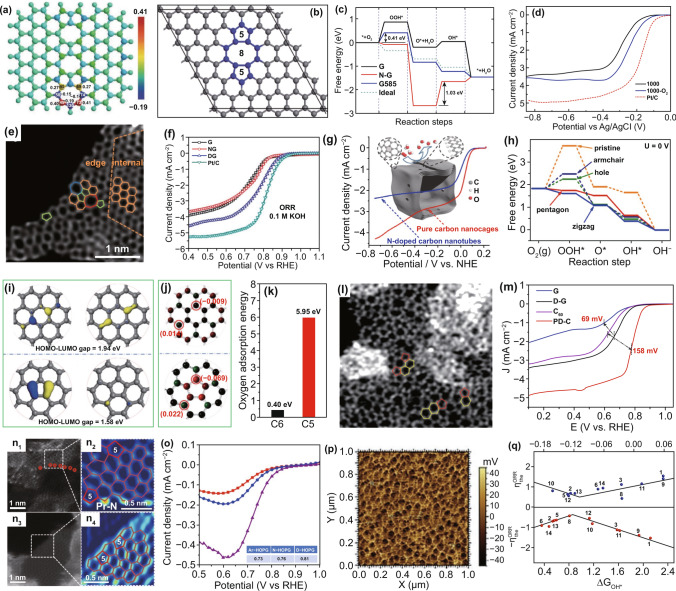
Topological defects in nanocarbon for ORR. a Charge and spin density distributions of the topological defective graphene model (GLD-558-01). Reproduced with permission from Ref. [39]. Copyright 2015, Royal Society of Chemistry. b Schematic representation of the G585 defect in graphene; c DFT-calculated free energy diagram of G, N–G, G585, and ideal catalysts; d ORR polarization curves of the prepared samples (C-1000, C-1000-O2) and Pt/C catalyst in an O2-saturated 0.1 M KOH solution. Reproduced with permission from Ref. [91]. Copyright 2015, Royal Society of Chemistry. e HAADF image of defective graphene (DG); f LSV curves for the pristine graphene, N-doped graphene (NG), DG and Pt/C catalyst in an O2-saturated 0.1 M KOH solution. Reproduced with permission from Ref. [40]. Copyright 2016, Wiley–VCH. g LSV curves of CNC700 and N-doped CNTs in O2-saturated 0.10 M KOH solution. The inset is the schematic structural character of CNC700 along with pentagon and zigzag edge defects; h DFT-calculated free energy diagrams of different defects in graphene catalyst models. Reproduced with permission from Ref. [93]. Copyright 2015, American Chemical Society. i–k HOMO–LUMO energy gap, charge density distribution, and k oxygen adsorption energy of pentagonal and hexagonal models. l STEM image of pentagon defect-rich carbon nanomaterial (PD-C); m LSV curves of the samples. Reproduced with permission from Ref. [92]. Copyright 2019, Wiley–VCH. n1,3 The HAADF–STEM images of N–G and D–G. n2,4 Expanded images of the dotted boxes from the corresponded N–G and D–G samples; o LSV curves of Ar-HOPG (red), N-HOPG (blue), and D-HOPG (purple) catalysts in 0.1 M H2SO4 solution; inset is the correlated onset potentials of the catalysts. Reproduced with permission from Ref. [45]. Copyright 2019, Nature Publishing Group. p KPFM test of plasma-treated HOPG; q The DFT-calculated overpotentials for ORR based on charge and intermediate binding energies. Reproduced with permission from Ref. [95]. Copyright 2018, Wiley–VCH

