
Figure 1.
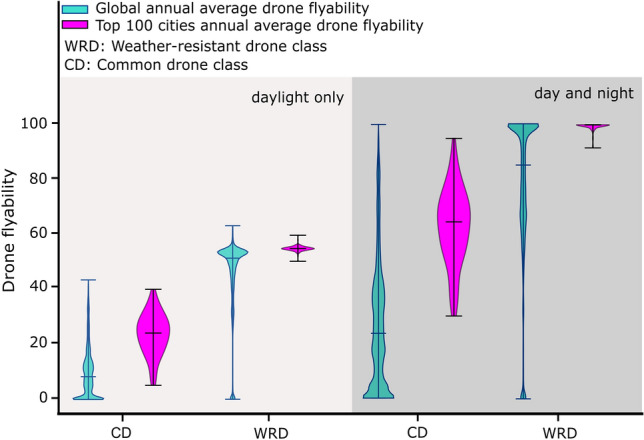
Violin plots of day-and-night and daylight-only flyability for CD and WRD. Cyan violins correspond to the distribution of flyabilities of CD and WRD globally and orange violins represent the distribution of flyabilities of CD and WRD from 100 most populated cities across the world22. The upper and lower hinges of violin plots indicate the minimum and maximum flyabilities. The horizontal bar of each violin represents the median of annual average drone flyability.