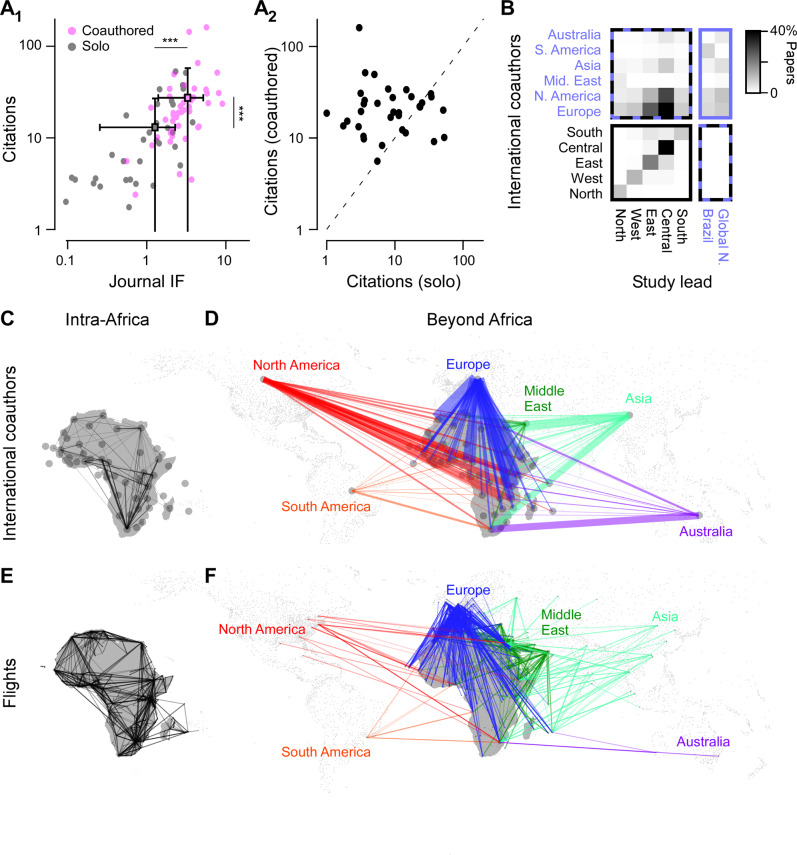
Fig. 3. Co-authorships.
A1 Citations plotted against the journal impact factor (IF) for each African country, divided into publications without (grey, ‘solo’) and with international co-authors (pink, ‘coauthored.’). The latter included both within-Africa international co-authors as well as co-authorships beyond Africa’s borders. Square-markers and errors denote each population’s mean and s.d. Both citations and IFs were significantly higher for internationally co-authored papers (Wilcoxon Rank Sum, 1-tailed, ***p < 0.001, full p values: 7.7 × 10⁻¹⁵ and 1.1 × 10⁻¹² for citations and IF, respectively; n = 45 countries in both cases). A2 The same citation data as (A1) plotted pairwise for with (y-axis) and without international co-authors (x-axis), highlighting the substantial positive influence of international co-authors. Dotted line indicates parity. B Co-authorship matrix between African regions and the rest of the world, with darker colours indicating a higher preponderance of international co-authorships. C, D Intra-African (C) and Beyond-African (D) co-author links organised by African country and major geopolitical regions beyond Africa, as indicated. The thickness of lines illustrates the total number of internationally co-authored papers, while colourings in (D) illustrate the co-authorships with partner beyond Africa. E, F as (C, D), respectively, but for the existence of international flight routes based on data from OpenFlights.org. Each route is illustrated with a single line of consistent opacity and thickness. Source data are provided as a Source Data file.

