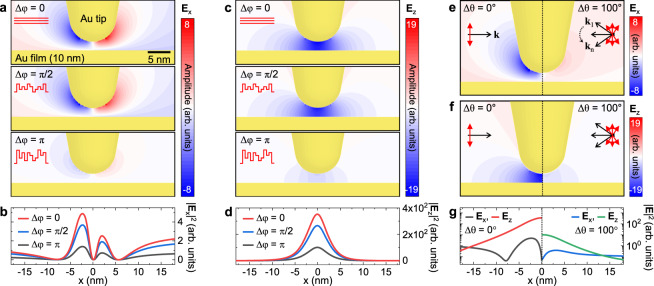
Fig. 2. Finite-difference time domain (FDTD) analysis of wavefront shaping the tip apex field.
a, c Simulated in-plane (Ex) and out-of-plane (Ez) optical field distribution with respect to the spatial phase variation (Δφ, see Methods for details). b, d In-plane (∣Ex∣2) and out-of-plane (∣Ez∣2) optical field intensity profiles at the horizontal plane 1 nm underneath the tip derived from (a, c). e, f Comparison of Ex and Ez optical field distribution for optimal (left) and conventional (right) excitation polarization conditions by wave-vector variation (Δθ, see “Methods” for details). g Optical intensity profiles at the horizontal plane 1 nm underneath the tip derived from (e, f), exhibiting significantly reduced excitation rate in the conventional experimental condition.

