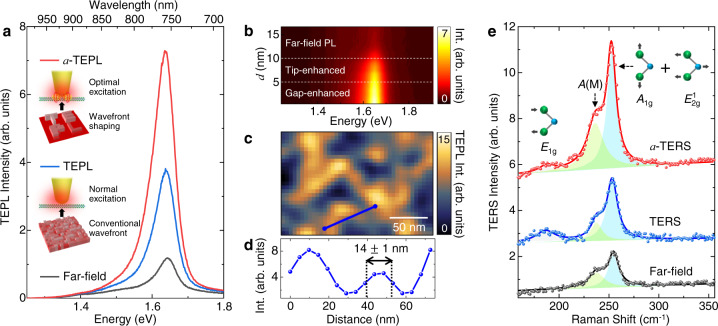
Fig. 3. Augmented TEPL and TERS responses through the wavefront optimization process.
a Comparison of far-field PL (black) and TEPL spectra of a WSe2 monolayer without (blue) and with wavefront shaping (a-TEPL, red). b Evolution of a-TEPL spectra as a function of distance d between Au tip and the crystal (WSe2 monolayer), exhibiting gradual PL enhancement through the tip-enhanced and gap-enhanced regions. c a-TEPL image of a WSe2 monolayer on Au film, and (d) a-TEPL intensity profile indicated as a blue line in Fig. 3c, showing a spatial resolution of ~14 nm. The same Au tip and sample were used for the results of Fig. 3a–d. e Comparison of far-field Raman (black) and TERS spectra of a WSe2 monolayer without (blue) and with wavefront shaping (a-TERS, red) with Lorentz profile fit. Raman active E1g, A(M), and A1g + E modes are observed. See SI for real PMs we used for the measurements (a) and (e).

