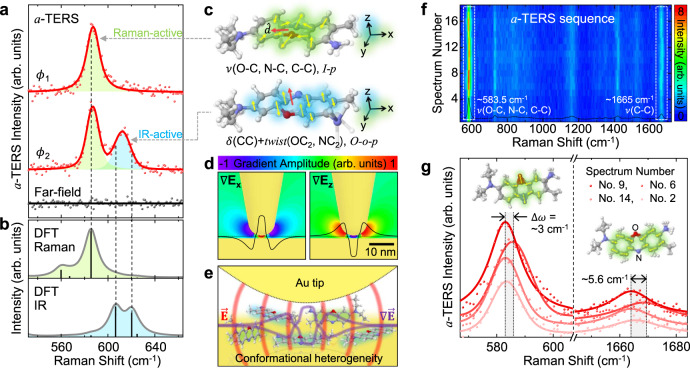
Fig. 4. Symmetry-selective tip-enhanced Raman spectroscopy of BCB molecules.
a Measured far-field (black) and wavefront-shaped TERS (a-TERS, red circle) spectra for BCB molecules with Voigt profile fit (red line). Distinct a-TERS spectra (ϕ1 and ϕ2) are observed with near-field polarization-control. b Calculated vibrational spectra of a BCB molecule with Raman-active (green) and IR-active (blue) normal modes. c Illustrations for the vibrational modes of ~583.5 cm−1 (top) and ~620 cm−1 (bottom) peaks (vibrational mode of ~606 cm−1 peak is similar to ~620 cm−1 peak). Blue, red, gray, and white atoms indicate nitrogen, oxygen, carbon, and hydrogen, respectively. Abbreviations used: stretching (ν), bending (δ), in-plane (i-p), out-of-plane (o-o-p), and dipole derivative unit vector (). d Simulated in-plane ( ∇Ex) and out-of-plane ( ∇Ez) optical field gradient distribution in the vicinity of Au tip with gradient amplitude profile at the horizontal plane 1 nm underneath the tip (black line). Hyperbolic tangent function is used for normalized amplitude scale. e Illustration of the conformational heterogeneity of molecules in the tip-substrate gap. f Time-series of a-TERS spectra with dynamic wavefront shaping, exhibiting spectral fluctuation due to the symmetry-selective TERS response of heterogeneously oriented molecules. g Selected a-TERS spectra from the regions indicated by the white dashed boxes in (f). Voigt profile fits (solid line) show apparent peak shift of the in-plane stretching modes (~583.5 cm−1 and ~1665 cm−1).

